
Introduction
Undergraduate science, technology, engineering, and mathematics (STEM) courses play a vital role in the training and development of future scientists, physicians, and engineers. However, undergraduate STEM programs can suffer from high attrition rates (Malcom & Feder, 2016; Sithole et al., 2017), and the loss of students from these undergraduate programs acts as a barrier for access to science and engineering-related fields and industries (Doerschuk et al., 2016). In the past few decades, many forms of active learning have been conceptualized and implemented in attempts to enhance undergraduate student learning experiences (Bonwell & Eison, 1991; Tanner, 2013). Importantly, these active learning approaches have been shown to increase student knowledge acquisition, performance, and retention in STEM (Freeman et al., 2014; Theobald et al., 2020).
The Team-Based Learning Approach
Small group work, also known as collaborative learning, is a widely used form of active learning that can improve student performance and engagement (Kyndt et al., 2013; Yang, 2023). However, small group work must be implemented properly for students to benefit from this collaborative approach. For example, a lack of structured discussions can lead to off-topic conversations, and unprepared students may be unable to communicate effectively with their peers, devaluing the team’s learning experiences. For optimal success in a collaborative learning environment, students should be motivated to regularly attend, prepare, and participate in on-topic discussions with peers (Michaelsen et al., 2004).
Team-based learning is a highly structured form of small group work that motivates students and holds them accountable for their learning. Developed by Larry Michaelsen over 40 years ago in a business school, TBL involves a specific sequence of individual and team activities (Michaelsen et al., 2004). A typical TBL-taught course is comprised of individual units or modules each arranged into three separate phases (Michaelsen & Sweet, 2008), all of which are thought to be important for student learning (Roossien et al., 2022).
Phase 1 involves pre-class preparation, such as reading an assigned textbook chapter, slide decks, and/or watching video lectures. During Phase 1, students begin learning important foundational concepts, which are described in the learning objectives for that module. Next, in Phase 2, students complete the in-class readiness assurance process (RAP) that consists of 3 elements: an individual readiness assurance test (iRAT), a team or group readiness assurance test (tRAT/gRAT), and class-wide discussion/feedback from the instructor (Michaelsen & Sweet, 2008). The iRATs are completed individually by students and generally consist of 10-20 multiple-choice questions (MCQs), which take roughly 15 minutes to complete. The iRAT is a mechanism to hold students accountable for their individual pre-class learning, to encourage attendance of students to class, and to prepare students for end-of-course summative assessments. Next, students collaborate in small teams (5-7), which are most often permanently established at the beginning of a semester and retake the iRAT as a team in the form of a tRAT (Michaelsen & Sweet, 2008). Teams are allowed to debate answers and come to a consensus for every question. Upon submission of an answer, teams receive feedback on whether their response is correct, and in many cases, use immediate feedback after testing (IF-AT) cards. If a choice is incorrect, the students have an opportunity to select another option following more discussion. After the tRAT has completed, the instructor gives the students an opportunity to appeal missed questions. Lastly, the instructor begins a mini lecture to review important concepts and provide feedback on the quiz, often focusing on the most missed questions (Michaelsen & Sweet, 2008).
In the final phase of a TBL module, students engage in an application-focused activity. The team application activity (tAPP) can occur immediately after the readiness assurance or during the next class period, depending on the length of each class period. The application activities align with Bloom’s higher cognitive levels of learning, encouraging analysis, application, and evaluation (Bloom, 1956). Activities follow the “4-S” framework: 1) students solve a significant problem; 2) all teams work on the same problem; 3) students, as a team, select the best solution from a list of options; and 4) all teams report their choices simultaneously (Michaelsen & Sweet, 2008). Finally, at the end of a semester or at any frequency chosen, students complete peer evaluations to hold each other accountable for individual preparation for TBL sessions and participation in team discussions. Generally, TBL courses are graded based upon a metric which combines a student’s iRAT performance, tRAT performance, peer-evaluation ratings, and summative exam scores.
Literature Review
TBL is widely used in the health sciences, including medical, nursing, and physical therapy programs, as well as vocational training and undergraduate institutions (Haidet et al., 2012; Roossien et al., 2025; Sisk, 2011; Swanson et al., 2019). Not surprisingly, a growing body of research has emerged that has studied the impacts of TBL on student performance and perception of the learning environment. Meta-analyses tracking student performance in a mix of undergraduate and graduate/professional degree student populations have found moderate to large positive effects (mean effect size 0.55 to 1.13) for content knowledge outcomes in TBL courses when compared to non-TBL course versions (Gao et al., 2024; Swanson et al., 2019; Xiaoyan et al., 2024). In addition, a number of systematic literature reviews have been performed to address student outcomes with TBL, focusing on content knowledge and student perceptions (Rob Burton et al., 2024; Gao et al., 2024; Korayem et al., 2024; Reimschisel et al., 2017; Roossien et al., 2025; Xiaoyan et al., 2024; Xie et al., 2025; Yeung et al., 2023). In the health sciences, one literature review tracking 118 TBL studies noted that in general, TBL groups outperformed non-TBL groups (typically lecture-based control groups) and that students in TBL classes typically had improved attitudes toward the course (Reimschisel et al., 2017). Similarly, Roossien et al. (2025) found that the majority of the 179 articles tracked in their study reported higher scores for student performance and perceptions with TBL. In nursing education, Xiaoyan et al. (2024) noted that TBL was associated with improved exam performance, communication skills, and self-directed learning, and practical skills of nursing students, while Gao et al. (2024) reported consistent findings, with the exception that practical nursing skills did not improve with TBL. Finally, one literature review of TBL in medical school education found that students in TBL had improved final scores, engagement, motivation, and course satisfaction (Xie et al., 2025). Taken together, these meta-analyses and literature reviews consistently demonstrate positive student outcomes with TBL.
The improvements in student performance with TBL can likely be attributed to several aspects of the TBL course design. First, the frequent use of formative assessments in TBL modules (iRATs, tRATs, and tAPPS) offers students numerous opportunities for retrieval practice, an evidence-based learning technique that also works well when distributed throughout the semester (Butler et al., 2014; Dunlosky et al., 2013). Second, during each TBL session, students receive immediate feedback after tRATs and tAPPs. Providing timely feedback is important to help students correct errors in thinking and reinforce content knowledge (Butler et al., 2014; Phelps, 2012). Third, the frequent use of individual and team assessments as well as peer evaluations creates a motivational framework by holding students accountable for their learning and team contributions. Finally, the frequent social interactions and collaboration that occur in a TBL classroom may help promote positive emotions and a strong sense of student belonging, which support student learning (Cavanagh, 2016).
Our current understanding of student outcomes with TBL has largely been informed by studies tracking medical school and nursing school student populations, and it is unknown whether those findings with TBL can generalize to other student populations. While the retrieval practice and timely feedback used in TBL would be expected to benefit learners across a range of ages and grade levels (Dunlosky et al., 2013), the impacts of TBL on undergraduate students are not well known. In addition, while mixed active learning approaches are associated with improved student performance in undergraduate STEM education, TBL, as one specific form of active learning, has not been thoroughly studied in this undergraduate student population. To address this gap in our understanding, we carried out a systematic literature review of the research reporting on student outcomes with TBL in undergraduate STEM education. Using search terms for TBL and specific STEM disciplines, our PRISMA approach identified 55 studies published between 2005 and 2024. In our review of these articles, we track TBL implementation practices and provide an analysis of the data on student performance and perceptions of the TBL classroom.
Methodology
This literature review followed the Preferred Reporting Items for Systematic Reviews and Meta-Analyses (PRISMA) guidelines (Moher et al., 2009; Page et al., 2021) to systematically conduct a search of the literature on the impacts of TBL in undergraduate STEM education. The PRISMA protocol was not pre-registered.
Search Procedure
To identify articles relevant to TBL in undergraduate STEM education, we inputted the following search term s in the databases (APA PsychINFO, Academic Search Complete, Education Full Text, ProQuest Education Database, PubMed, Scopus, and Web of Science) for titles and abstracts of peer-reviewed articles: (“Team-based learning”) AND (acoustics OR agricultural OR agriculture OR agronomy OR algebra OR analysis OR anatomy OR animal OR anthropology OR astronomy OR astrophysics OR atmospheric OR bacteriology OR biochemistry OR bioengineering OR bioinformatics OR biology OR biomathematics OR biomedical OR biometrics OR biometry OR biophysics OR biopsychology OR biostatistics OR biotechnology OR botany OR calculus OR cardiovascular OR cartography OR chemistry OR climatology OR computer OR crop OR dairy OR dynamics OR earth OR ecology OR embryology OR endocrinology OR engineering OR entomology OR environmental OR ethology OR food OR forestry OR genetics OR genomics OR geochemistry OR geology OR geophysics OR geropsychology OR histology OR horticultural OR horticulture OR hydrology OR immunology OR informatics OR information OR life OR limnology OR marine OR materials OR mathematics OR mechanics OR mechatronics OR meteorology OR microbiology OR modeling OR nanotechnology OR natural OR neuroanatomy OR neurobiology OR neuropharmacology OR neuroscience OR nutrition OR oceanography OR oncology OR optics OR paleontology OR parasitology OR pathology OR petrology OR pharmacology OR physical OR physics OR physiology OR plant OR poultry OR probability OR programming OR psychology OR psychometrics OR psychopharmacology OR radiobiology OR research OR robotics OR science OR seismology OR soil OR statistics OR STEM OR technologies OR technology OR toxicology OR virology OR wood OR zoology). When searching titles and abstracts with these terms, we did not encounter limits on the number of search terms allowed.
Different approaches have been described in the literature to identify articles published in the field of STEM education. Systematic literature reviews typically search general terms like “STEM education” or target searches to journals known to publish undergraduate STEM education research (Li et al., 2020; Liu & Kringos, 2025). We found that terms like “STEM,” “undergraduate,” “university,” and “higher education” were often absent from the titles and abstracts of relevant articles. To increase the number of potentially relevant articles retrieved, we searched the names of specific STEM disciplines in an approach similar to Xu and Ouyang (2022). The STEM subjects listed in our search terms were drafted through a refinement of the United States National Science Foundation online list of university subjects (previously found on this website, but no longer availablehttps://ncsesdata.nsf.gov/sere/2018/html/sere18-dt-taba001.html), excluding terms irrelevant to STEM education, specific to occupations, or redundant. Additionally, we found that limiters in the form of NOT operators had unintended consequences of excluding potentially relevant articles. All references were exported to EndNote 21™ bibliographic software and automatically screened for duplicates. After further manual duplicate removal, the search yielded 1,522 unique articles for screening (Figure 1).
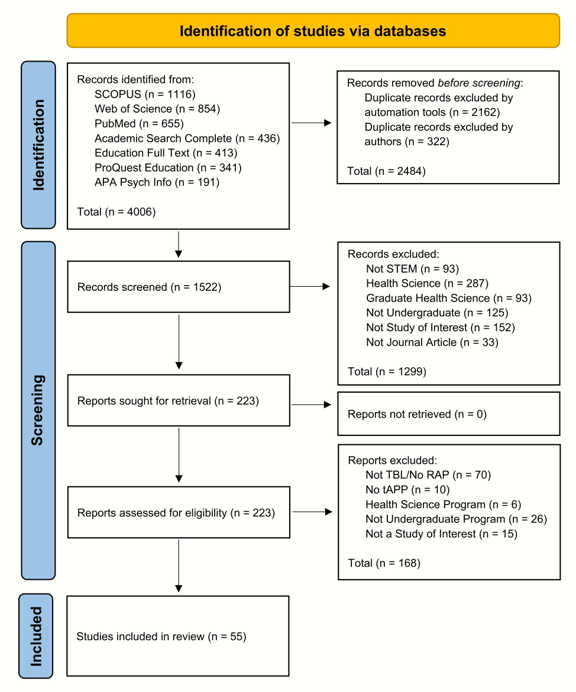
Figure 1. The PRISMA Approach, Highlighting the Identification of Articles, Screening Process, and Studies Included in the Review
Screening process
Our review relied on the following inclusion criteria to screen for and select relevant articles for our review of the literature on TBL in STEM undergraduate education:
Studies are peer-reviewed journal articles.
Studies apply TBL (Team-based Learning), understood as an explicitly defined sequence of iRAT, gRAT/tRAT, and tAPP following the outline of Michaelsen and Sweet (2008), to a classroom.
Classroom(s) under study must be a STEM (science, technology, engineering, and mathematics) course offered at an undergraduate institution. Interprofessional programs and health science programs (medical, nursing, dental courses, etc.) are excluded.
Students under study are stated to be no more than four years into their respective programs. Studies which differentiate results based upon year of student may be included if some students are above the fourth year.
Studies must evaluate the effects of TBL or perception of TBL among students, meaning that only quasi-experimental, experimental, and crossover study designs are included.
The screening process proceeded in multiple phases. First, a sweep of the abstracts and titles revealed articles that were clearly unrelated to TBL, STEM education, or references which were not research articles, such as letters to the editor. A second, more detailed sweep of the abstracts allowed us to exclude articles that featured student populations irrelevant to our review; whether at the graduate level, in health science programs, in interprofessional programs; or articles which did not feature any instruments evaluating the effects of TBL on student learning or perception of classroom dynamics. We excluded articles published in the health sciences, as 1) these student populations have been the focus of several other systematic reviews; and 2) our target student population was undergraduate STEM students, specifically those not enrolled in professional programs. Additionally, for articles not published in English, translations of the abstracts were obtained through services including DeepL and Google Translate. These articles were identified as having student populations within Health Science programs, and they were excluded for not focusing on undergraduate student populations. These initial screenings excluded 1,299 articles, leaving 223 references for record retrieval and assessment for eligibility (Figure 1).
After all records were retrieved, every article was screened one final time for inclusion. The 223 articles were split between two of the authors for screening. Articles that were considered a clear yes or no for inclusion were not discussed between the authors. For the remaining articles, multiple rounds of deliberation took place between the authors until unanimous agreement was reached. 168 articles were excluded through this process, leaving 55 articles for inclusion in our literature review (Alvarez-Bell et al., 2017; Anas et al., 2022; Antonis et al., 2023; Ariati et al., 2023; Atwa et al., 2019; Barbee et al., 2018; Baty & Bruns, 2024; Beneroso & Erans, 2021; Beumer, 2018; Campbell & Taylor, 2020; Carlos et al., 2023; Castro et al., 2021; Charalambous et al., 2021; Comeford, 2016; Davis & Burke, 2023; Duzhin & Gustafsson, 2018; Ford, 2018; Gazave & R. Hatcher, 2017; Haberyan, 2007; Hancock, 2024; Hazel et al., 2013; Huijbregts et al., 2022; Jakobsen & Daniel, 2019; Johnson, 2017; Lekhi & Varao-Sousa, 2023; Leupen et al., 2020; Lewis et al., 2021; Lewis & Estis, 2020; Marwaha et al., 2021; Meeuwsen et al., 2005; Metoyer et al., 2014; Mitchell & Vaughan, 2022; Moore et al., 2020; Najdanovic-Visak, 2017; Nanes, 2014; Ng & Newpher, 2020, 2021; Oates et al., 2016; Parappilly et al., 2015, 2021; Pasquini et al., 2023; Patil et al., 2022; Peters et al., 2020; Peterson & Carrico, 2015; Pollack, 2018; Ramos-Rodriguez et al., 2024; Tan et al., 2022; Travis et al., 2016; Tsai, 2016; Vance, 2021; Vogler et al., 2021; Wu et al., 2020; Yuretich & Kanner, 2015; Zha et al., 2021).
Coding and Data Analysis
Each article included within our review was distributed to two of the four authors for coding. Initially, 25 different variables were tracked: study size, undergraduate yes/no, journal, country, STEM discipline, STEM area, course name, intervention, RAT procedure, tAPP procedure, class size, preparatory phase materials, peer evaluation yes/no, appeals yes/no, feedback yes/no, demographics, retention data yes/no, team size, TBL session number, performance results yes/no, performance comparison, performance on iRAT vs tRAT, perception results yes/no, perception instrument, and interviews/focus groups. These variables were recorded by each author for every article. For variables tracking one-word or simple responses, such as the country, discipline, STEM area, or course name, the average percent agreement between coders was 81.7%. For the open-ended variables, such as summaries of performance or perception results, it was not possible to calculate percent agreement, given the lengthy and unique summaries provided by each coder. The two codings for each article were then consolidated, and all discrepancies were resolved through deliberation among the authors. The initial list of variables was further subdivided into 36 separate variables, which are presented in the evidence table (Appendix).
Findings / Results
TBL studies by year, location, STEM field, and discipline
The PRISMA approach described in our methods (Figure 1) identified 55 undergraduate TBL STEM studies published between the years 2005 and 2024 (Figure 2A). 67.3% of the studies were published by corresponding authors based out of North American universities, and the top four countries of origin included the United States (65.5%), the United Kingdom (9.1%), Australia (7.3%), and Singapore (3.6%) (Figure 2B). The 55 studies were published in 43 different peer-reviewed journals (Appendix). The Journal of College Science Teaching and the Journal of Statistics and Data Science Education were the most popular journals, each publishing four studies.
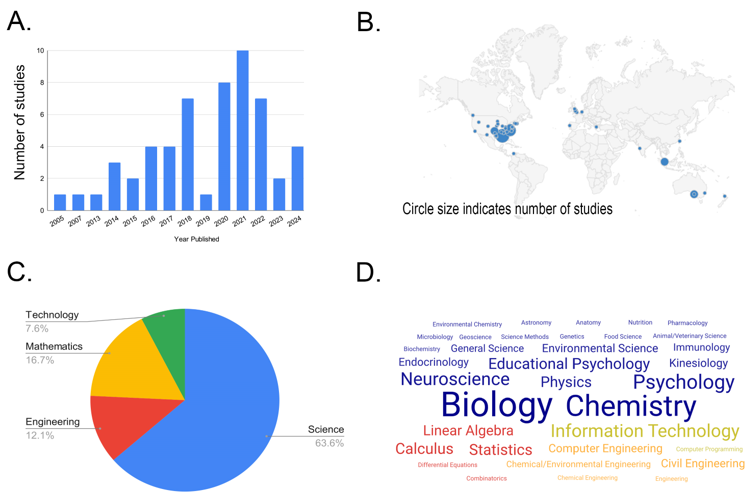
Figure 2. TBL Studies by Year, Location, STEM Field, a nd Discipline. A. Number of Studies Published Per Year. B. Locations of TBL Studies Based on Corresponding Author Affiliation. The Size of Each Circle Correlates With the Number of Studies (For Example, The Smallest Dots = One Study). C. The Percentage of Courses Classified as Science, Engineering, Mathematics, or Technology. D. Word Cloud Indicating the Relative Numbers of STEM Subjects Represented in t he 66 Courses
Eight of the TBL studies in our collection characterized more than one course and two separate studies examined the same individual course. As such, there were a total of 66 different courses analyzed within the 55 studies (66 courses = (46 studies x 1 course) + (7 studies x 2 courses) + (1 study x 3 courses) + (1 study x 4 courses) – (1 double-counted course)). From these 66 courses, all STEM areas were represented, with 63.6% classified as science, 16.7% mathematics, 12.1% engineering, and 7.6% technology (Figure 2C). In addition, 35 different STEM subjects were represented in these courses, and the top six most commonly found course subjects were Biology (n = 5), Neuroscience (n = 4), Information Technology (n = 4), Psychology (n = 4), Computer Engineering (n = 4), and Chemistry (n = 4) (Figure 2D). The full list of STEM subjects is included in the Appendix.
Classroom and Team Characteristics From TBL Studies
We also tracked several characteristics of the TBL classrooms described in these studies. While online use of TBL has become more popular in recent years, the 66 courses were mostly taught in person (84.8%) with only 3% being fully online courses (Figure 3A). The remaining 12.1% were either online or in-person depending on the year the course was taught. Next, we tracked the class section size reported for each of the 66 courses. We found that class section size ranged from six students in the smallest section to 300 students in the largest section. For each course, we categorized the reported class section sizes as small (1-20 students), medium (21-100 students), or large (>100 students). For some courses, section sizes varied across terms or during the same term. Courses with multiple section sizes reported were coded as medium/large, small/medium, or small/medium/large. We found that medium-sized class sections were the most common size across the 66 courses (43.9%) (Figure 3B). From the 66 courses, we also found that 86.3% implemented TBL for the entire duration of the course term (standard course), and three courses used TBL for a single module (Figure 3C). In addition, we identified six short TBL courses that spanned approximately one week in length each. Finally, most courses involved a single instructor (48.5%), while the remaining courses used multiple instructors (up to a maximum of 15) or included no information about instructor number (Figure 3D).
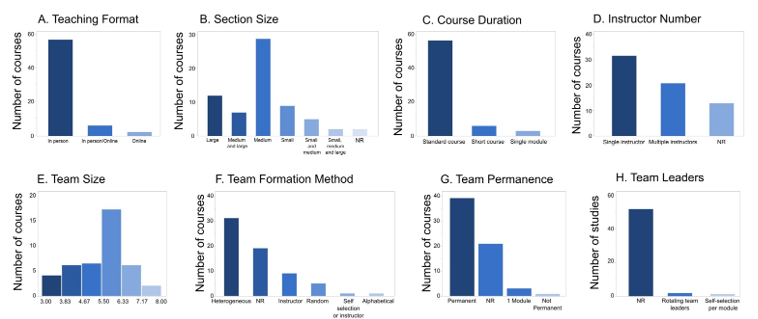
Figure 3. TBL Team and Classroom Characteristics. Bars Indicated the Number of Courses With the Indicated Teaching Format (A), Section Size (B), Course Duration (C), Instructor Number (D), Team Size (E), Team Formation Method (F), and Team Permanence (G). The Number of Studies Describing Use of Team Leaders in TBL Teams i s Shown i n (H). N = 66 Courses a nd 55 Studies, And NR = Not Reported in the Study
To better understand the characteristics of the TBL teams in these courses, we analyzed team formation methods, team size, number of teams per section, team permanence, and the use of team leaders. The average reported team size across courses was 5.4 (5.5 median) and ranged from three to eight members (Figure 3E). Team size was not reported for 39.4% of courses. The number of TBL teams per classroom averaged ~12, consistent with most class sections being categorized as medium-sized (21-100 students). For most courses, teams were designed by the instructor to be heterogeneous (50%) based on several sorting factors, including grades, academic background, demographics, and year of study (Figure 3F). We also found that in some courses, teams were formed randomly (n = 5), alphabetically (n = 1), self-selected by students (n = 1), or teams were instructor-designed with no specific sorting method described (n = 7) (Figure 3F). In addition, team formation methods were not reported for 19 courses. Most courses used permanent teams (59.1%), while 34.8% had no information on team permanence (Figure 3G). A single course used non-permanent teams, and three courses only implemented TBL for a single module (Figure 3G). Finally, only three studies out of 55 reported assigning team leaders within TBL teams (Figure 3H).
TBL Implementation Practices
TBL implementation practices varied across the 55 studies. We first focused on variations in the three phases of TBL, looking at whether studies reported preparatory activities, the timing of tRAT feedback, and the type of application activity. Of the 66 courses tracked in these studies, 87.8% reported using preparatory materials (Figure 4A), which included readings, slides, notes, guides, and videos. Readings were the most common preparatory material reported (66.7%), and more than half of courses (51.5%) used multiple types of preparatory materials. Only 12.1% of courses did not have a specific type of preparatory material described. We also found differences in the timing of feedback at the end of the tRAT. Most (65.2%) courses used immediate feedback, 15.2% delayed feedback, and 19.7% did not specify the timing of feedback (Figure 4B). In addition, we tracked the type of team application activity reported for each course. While 40.9% of courses did not have a specific type of activity described, 10.6% (n = 7) followed the 4-S model only, 28.8% used non-4-S designs only, and 19.7% reported using a mix of both (Figure 4C).
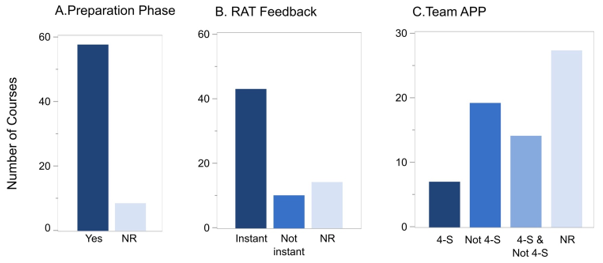
Figure 4. TBL Implementation Practices for Preparation, Appeals, Feedback, and 4-S Questions. Bars Indicate the Number of Courses That Included (“Yes”) a Preparation Phase (A), the Type of RAT Feedback (Instant, Not Instant) (B), and the Type of Tapp (4-S, Not 4-S, 4-S and Not 4-S) (C). N = 66 Courses and NR = Not Reported for the Course
To further characterize implementation practices, we counted the number of studies with student appeals and peer evaluations, as well as student attendance and withdrawal data. 25.5% of studies tracked student appeals, 21.8% specified not using appeals, and 52.7% of studies did not report any information on appeals (Figure 5A). Peer evaluations were described in over half of the studies (52.7%), not implemented in 3.6% of the studies, and not mentioned in 43.6% of the studies (Figure 5B). Among the seven studies that reported attendance outcomes, all observed higher attendance rates in TBL sections compared to non-TBL sections (Figure 5C). Similarly, among the seven courses with withdrawal data, all noted lower withdrawal rates in TBL courses (Figure 5D).
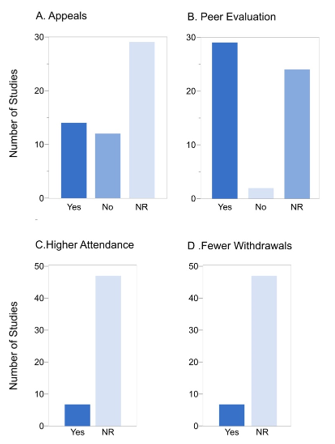
Figure 5. The Number of Studies Tracking Appeals, Peer Evaluation, Attendance, and Withdrawals. Bars Indicate the Number of Studies That Did (“Yes”) or Did Not (“No”) Implement Appeals (A), Peer Evaluation (B), Higher Attendance (C), and Fewer Withdrawals (D). N = 55 Studies, and “NR” = Not Reported in the Study
Student Performance in TBL
We also tracked student performance data and found that 70.9% of the 55 studies reported academic performance outcomes. Together, these studies generated 57 performance comparisons, of which 47 were between-subject and nine were within-subject designs. Of the studies that reported performance, most (76.9%) reported outcomes from a single assessment instrument, while 23.1% reported outcomes from more than one. Across all studies, the performance instruments included tests (individual and team readiness assurance tests and midterms administered during the semester), final exams, course grades, and written assignments, including open-ended questions and a lab report. Most studies reported improvement with TBL over non-TBL sections. When looking at the specific types of assessments, 8 out of 11 final exam comparisons, 22 out of 30 test comparisons, and 9 out of 10 course grade comparisons reported higher performance with the TBL groups compared to the non-TBL groups (Figure 6A-C). Only one study reported a decline of any kind in the TBL group compared to the non-TBL group (Figure 6D).
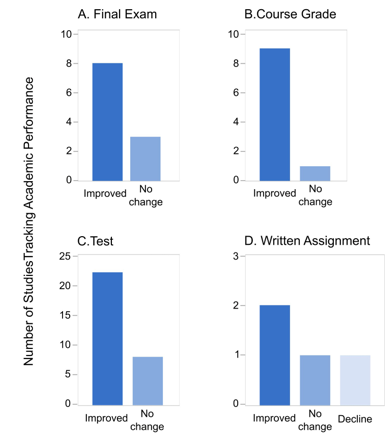
Figure 6. Academic Performance Outcomes in TBL Versus Non-TBL Compared by Assessment Type. Bars Indicate the Number of Studies Showing Improved, Unchanged, o r Declined Performance for Final Exams (A), Course Grades (B), Tests (C), and Written Assignments (D) When Studies Compare TBL to Non-TBL Course Versions. (N = 39 Studies)
Student Perception of TBL
Finally, we tracked whether studies reported on student perceptions of TBL. From the 55 TBL studies, 85% reported on student perceptions (Figure 7A), which included self-reported learning, engagement, overall experience, enjoyment, teamwork, motivation, difficulty, workload, course and instructor satisfaction, and general perceptions of TBL. Of the 47 studies that tracked perception, 87.2% described how the perception data were collected. For example, 20 studies collected perception data from unnamed Likert surveys, six studies used data collected from end-of-term course evaluations, one study mentioned informal feedback, and 14 studies used previously published and named instruments. These included the Community of Inquiry Instrument (Garrison et al., 1999), Self-Regulation of Learning questionnaire (Broadbent et al., 2023), Communication Apprehension survey (McCroskey et al., 1985), Grasha-Reichmann Student Learning Style Scales (Riechmann & Grasha, 1974), Team-Based Learning Student Assessment Instrument (Mennenga, 2012), and the revised Study Process Questionnaire (Biggs et al., 2001). Lastly, 43.6% of the studies reported collecting perception data in the form of open response questions and/or perception data from focus groups.
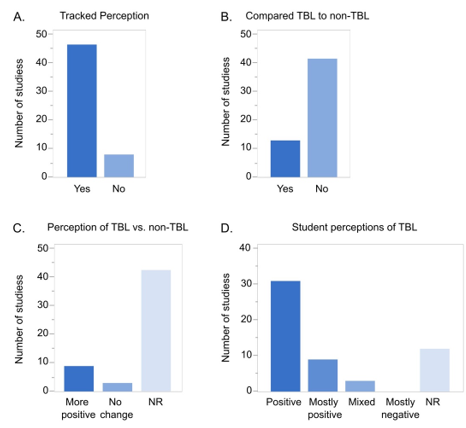
Figure 7. Student Perceptions of TBL. Bars Indicate the Number of Studies That Did (“Yes”) or Did Not (“No”) Track Student Perceptions of TBL (A), Whether the Studies Tracking Perception Did (“Yes”) or Did Not (“No”) Compare TBL t o Non-TBL (B), Whether Perceptions of TBL Were “More Positive” or Showed “No Change” Compared to Non-TBL (C), and the Overall Study Description (Positive, Mostly Positive, Mixed, or Mostly Negative) of Student Perception With TBL (D). N = 55 Studies and “NR” = Not Reported in the Study
While most studies reported on student perception of TBL (85.5%) (Figure 7A), only 12 of those 47 perception-tracking studies made a direct comparison between students’ perceptions of TBL and non-TBL course versions (Figure 7B). From the 12 courses that made this comparison, 75% reported more positive perceptions of TBL courses compared to non-TBL courses, and 25% reported no difference in perception (Figure 7C). None of the studies described students having a more negative perception of TBL compared to non-TBL. We also tracked author descriptions of student perceptions with TBL. From the 47 studies that tracked student perceptions of TBL, 65.9% were described by authors as being positive (meaning only positive student perceptions were provided in the study), 19.1% mostly positive (a few negative student perceptions of TBL were included), and only 6.4% a mix of positive and negative student perceptions (Figure 7D). Not all studies reporting on student perception tracked perception of TBL. Instead, these studies focused on another aspect of the course (e.g., perceptions of multiple-choice questions versus open-ended questions or how student engagement predicted self-reported learning). Taken together, most studies reported positive perceptions of TBL and, in general, student perceptions were more positive for TBL courses compared to non-TBL courses.
Discussion
Summary
Here, we have performed a systematic literature review on TBL in undergraduate STEM education. The PRISMA approach identified 55 studies that met our inclusion criteria and reported on implementation practices and/or student outcomes with TBL in undergraduate STEM courses (Appendix, Figure 1). The majority of these 55 publications came from North American universities and colleges, and the 66 courses analyzed represented 35 different STEM disciplines, with information technology, psychology, biology, chemistry, and neuroscience appearing most frequently (Figure 2). TBL implementation practices and classroom characteristics varied (Figures 3, 4, and 5), and most studies collected data on student performance and perceptions of TBL (Figures 6 and 7). Importantly, most studies demonstrated positive outcomes with the TBL approach.
TBL Implementation Practices
All of the courses described in these 55 studies followed the specific sequence of iRAT, tRAT, and tAPP described by Michaelsen (Michaelsen & Sweet, 2008). This sequence of events in the TBL process was a strict requirement for inclusion in our systematic review of TBL. However, our inclusion criteria did not require that studies follow all of the essential design elements of TBL outlined by Michaelsen and Sweet (2008). These design elements include 1) properly formed and managed groups, 2) student accountability for individual and group work, 3) frequent, immediate student feedback, and 4) using assignments that promote both learning and development. This decision was based on our finding that many studies underreported on the important course details that would have allowed us to track these essential design elements. Indeed, many of the studies we analyzed did not report on team size, team formation method, team permanence, team leaders, instructor number, use of 4-S questions, appeals, and peer evaluations. Therefore, our review also includes studies that did not follow or report on the essential elements of TBL, and we describe this variability across the 55 studies.
For the essential TBL element of “properly formed and managed teams,” we found that 50% of courses used teams that were designed by the instructor to be heterogeneous (Figure 3F). The actual percentage is likely higher, but 29% of the courses analyzed did not report the team formation method. In addition, some courses used teams that were designed randomly and, in one case, self-selected by students. To address “student accountability for individual and group work,” we tracked the use of peer evaluations/peer assessment. Here, we found that only 53.7% of the studies confirmed implementing peer evaluations (Figure 5A). For “frequent immediate student feedback,” we found that 10 courses in these studies provided delayed instead of immediate feedback on tRATs (Figure 4B). Furthermore, during application activities, many courses did not strictly follow the 4-S rule (specific choice, simultaneous reporting, significant problem, same problem) but rather used non-4-S assessments or a combination of 4-S and non-4-S type tAPPs (Figure 4C).
There are a number of potential explanations for the variations in TBL implementation practices reported in these studies. Depending on the STEM discipline, some topics or methods of problem solving do not easily allow for specific choices or simultaneous reporting of answers (e.g. STEM courses with large writing components or mathematics courses in which students calculate a specific answer). Furthermore, the 4-S approach can limit the types of application activities that can be performed, not allowing for open-ended response questions that may be preferred by some instructors. In addition, not all TBL practitioners are formally trained in the use of TBL and have not completed the certifications offered through the Team-Based Learning Collaborative. The cost of certification programs and attendance at national conferences, combined with a lack of institutional support for teacher trainings and workshops, could serve as barriers to widespread TBL training and implementation. Furthermore, it is possible that some studies did indeed implement all of the standard TBL components (4-S, appeals, peer evaluation) but simply did not report them in the research article. Finally, not all aspects of TBL were found to vary across these courses. Consistent with the recommended team size of 5-7 students (Michaelsen et al., 2004) for TBL, the courses in our studies averaged 5.4 members per team (Figure 3E).
Interestingly, we also found several examples of courses that added additional activities to the TBL process or implemented a modified version of TBL. For example, many courses used lectures as a form of preparatory material, pop quizzes were introduced (Barbee et al., 2018), and in many cases, iRATs were completed before class or online. In addition, one study explored how the use of open-ended tRAT questions impacted performance on the subsequent tAPP (Tan et al., 2022). Innovations to the TBL process are likely to emerge in the future, and it will be important to test the impacts of specific interventions on student outcomes.
Student Performance and Perceptions of TBL
Given the improved academic student outcomes that have been reported for active learning courses in undergraduate STEM (Freeman et al., 2014; Theobald et al., 2020), we were motivated to track whether similar outcomes were present in TBL, which can be considered a highly structured form of active learning. To assess student performance with TBL, most studies used either RATs, midterms, or final exams, and a few used written forms that included open-ended questions (Tan et al., 2022; Vogler et al., 2021; Zha et al., 2021) and a lab report (Wu et al., 2020). In nearly every study that tracked performance outcomes, student performance was found to be greater in TBL groups (Figure 6A-D). The improved performance for students in TBL courses is likely driven by evidence-based learning techniques, including retrieval practice, spaced practice, and timely feedback, all of which promote long-term retention of knowledge (Butler et al., 2014; Dunlosky et al., 2013). Given that these techniques can benefit learners across a range of ages and grade levels, it is not surprising that our findings with undergraduate learners largely reflect the positive outcomes with graduate/professional student populations.
In addition to student performance in TBL, many studies focus on student perceptions of the TBL classroom. In our collection, 47 studies tracked student perception data, which included many different perceptions of TBL: self-reported learning, engagement, overall experience, enjoyment, teamwork, motivation, difficulty, workload, course and instructor satisfaction, and general perceptions of TBL. A variety of instruments were used to collect perception data, including Likert surveys, end-of-term course evaluations, informal feedback, focus groups, and previously published instruments. Importantly, all 12 studies making comparisons between TBL and non-TBL controls reported either more positive perceptions for TBL (Atwa et al., 2019; Haberyan, 2007; Hancock, 2024; Jakobsen & Daniel, 2019; Lewis & Estis, 2020; Marwaha et al., 2021; Ng & Newpher, 2020; Patil et al., 2022; Yuretich & Kanner, 2015) or no change (Davis & Burke,2023; Jakobsen et al., 2014; Travis et al., 2016), but none reported more negative student perceptions with TBL (Figure 7A-D). Interestingly, these findings with TBL may contrast with non-TBL small group work in undergraduate STEM. For example, in a comparison between lecture-based and active learning course sections involving small group work, undergraduate physics students reported a greater preference for lecture-based learning compared to active learning, even though student performance was greater in the active learning group (Deslauriers et al., 2019). The authors proposed that this may be due to the increased cognitive effort required by active learning. While the reason for this difference between TBL and non-TBL small group work is not clear, it is possible that the use of permanent teams, peer evaluations, and the RA process in TBL may improve the student experience in small group work.
Conclusions
To our knowledge, this is the first systematic literature review to focus exclusively on student outcomes with TBL in undergraduate STEM education. Overall, the findings from our literature review support the idea that TBL is an effective teaching method for engaging undergraduate STEM students and improving content knowledge outcomes. In addition, these studies largely support what has been reported in the health sciences and professional education literature (Sisk, 2011; Swanson et al., 2019; Xiaoyan et al., 2024; Xie et al., 2025; Yeung et al., 2023). While the findings from this literature review suggest clear benefits of the TBL approach, additional work is needed in the future to generalize the findings and understand how TBL improves student outcomes.
Recommendations
Many important questions remain about the impacts of TBL on student outcomes in undergraduate STEM education and should be explored in future studies. For example, does the TBL approach improve student outcomes in STEM courses across a range of class sizes, class years, and disciplines, as well as differing educational contexts (community colleges and small colleges versus large research universities)? The majority of our 55 studies originated mostly from large universities (Appendix), with only a few examples of studies carried out at small colleges and community colleges. Unfortunately, the lower number of research studies stemming from small colleges and community colleges limits our understanding of TBL outcomes in different STEM student populations. Furthermore, only one study addressed the relationship between class size and student outcomes in TBL, with the results indicating that student performance and perceptions of TBL were similar between smaller and larger class sizes (Ng & Newpher, 2021). These findings are encouraging given the many negative outcomes that have been reported in higher education with large university classes (Cash et al., 2017). To this end, we recommend that future TBL studies explore its effectiveness across varied educational settings and classroom sizes.
While the studies in our literature review represent a wide range of STEM disciplines and classroom contexts, more work is needed to better understand whether all student populations benefit from this teaching approach. For example, it will be important to determine whether TBL in STEM has a positive impact on students from disadvantaged backgrounds, as has been shown for active learning in STEM (Theobald et al., 2020). One study outside of STEM education found that Black students in TBL received lower peer evaluation scores while maintaining similar course grades to their teammates’ grades (Macke et al., 2019). These findings suggest that implicit biases toward teammates can harm students from disadvantaged backgrounds and create a negative experience with TBL. In our 55 studies, only 24 included information on student demographics (race, ethnicity, sex, gender, and/or age) and only 10 of those studies explored relationships between student demographics and student outcomes, typically focusing on sex and gender (Lewis & Estis, 2020; Mitchell & Vaughan, 2022; Peters et al., 2020; Ramos-Rodriguez et al., 2024; Travis et al., 2016; Zha et al., 2021) and in one example, ethnicity (Beneroso & Erans, 2021), which found no differences among groups.
In the future, it will also be important to address whether online TBL engages students as well as in-person TBL and if online course versions can achieve similar student learning outcomes. TBL studies in medical education suggest that student performance is similar in online and in-person course versions, although students may prefer in-person TBL (Blondeel et al., 2021; R. Burton et al., 2024; DeMasi et al., 2019; Franklin et al., 2016). Surprisingly, only eight of the studies in our review included data from courses taught online, but similarly, students performed well in online TBL and reported positive perceptions (Anas et al., 2022; Antonis et al., 2023; Gazave & Hatcher, 2017; Patil et al., 2022; Tsai, 2015). We would expect an increase in studies of online TBL to be published in the future, given the widespread adoption of remote and online teaching practices in the COVID-era and the popularity of online course offerings in higher education.
Furthermore, while many studies track the initial implementation of TBL and associated student outcomes, none of the studies in our collection tracked the long-term impacts on post-graduation plans and career outcomes. Indeed, the learning in a TBL STEM classroom likely goes beyond content knowledge and includes critical thinking abilities and the development of essential soft skills (e.g. leadership and collaboration) that are necessary to perform at a high level in the STEM workplace. Additional data on the long-term impacts of TBL could provide further justification for the continued use of the TBL approach.
We also found that many studies published on TBL are not implementing TBL as described by (Michaelsen et al., 2004), or that critical details of their implementation process are underreported. This is a problem for multiple reasons. First, if essential elements of TBL are not followed by TBL practitioners, it could limit the effectiveness of TBL and student learning in those classrooms. Second, underreporting on these critical TBL design elements limits the ability of other researchers to interpret and analyze findings. In general, the TBL research field would benefit from more rigorous reporting of TBL implementation practices and a standardized set of best practices when reporting on TBL educational research. Such practices would allow for more accurate and informed literature reviews and meta-analyses on TBL. We recommend that authors publishing TBL research provide thorough descriptions of the three major TBL phases (preparation, readiness assurance, application) as well as other important details related to the essential elements of TBL (Michaelsen & Sweet, 2008).
Finally, while our literature review provides a qualitative description of student performance in TBL, we have not performed a quantitative meta-analysis of the student learning outcomes. In the future, such analyses will be important to better define content knowledge outcomes associated with TBL in undergraduate STEM. As outlined in Swanson et al. (2019), a successful meta-analysis requires detailed reporting from study authors on sample sizes, student populations, and statistical information to allow for the calculation of effect sizes. For these reasons, TBL researchers measuring student outcomes should report all critical details of research studies to allow for inclusion of their findings in subsequent meta-analyses.
Limitations
Our PRISMA approach identified 55 undergraduate STEM studies for inclusion from a total of 223 reports that were initially assessed for eligibility. While many of the 223 articles self-identified as TBL or team-based, our analysis of these articles and the methods revealed that, in some cases, major components of the TBL process were not followed or reported. For example, 70 studies that self-identified as team-based learning were excluded for not describing a readiness assurance process, and 10 other studies were excluded that described a readiness assurance process but failed to report on the use of team application activities (Figure 1). We acknowledge that some of these excluded studies may have implemented TBL as outlined in Michaelsen et al. (2004), and that the exclusion of these articles could have affected our key findings. However, given our strict adherence to the inclusion criteria described in our methods, we were forced to exclude articles that did not provide all of these critical TBL course details. We apologize to any authors whose TBL work was not included in our literature review for these reasons.
We thank Caroline Wilson for helpful comments on this manuscript.
Conflict of Interest
The Authors declare that there is no conflict of interest.
Funding
This work was funded by Duke University and the Charles Lafitte Foundation Program in Psychological and Neuroscience Research at Duke University.
Generative AI Statement
AI was not used for this literature review.
Supplementary Materials
The evidence table, detailing the 55 studies included in the systematic literature review, is available at https://bit.ly/3QrySwF.
Authors Contribution Statement
Koch: Conceptualized and designed the study, undertook a systematic search of the literature, screened the articles, coded the articles, analyzed and interpreted the articles, drafted and edited the manuscript, and approved the final version. Chrapliwy: Coded articles and revised the final manuscript. Ng: Coded articles, made figures, and drafted, edited, and revised the manuscript. Newpher: Conceptualized and designed the study, screened the articles, made figures, coded articles, drafted, edited, and revised the manuscript, and approved the final version.