
Introduction
Shared in this paper is a research methodology that drew on an analysis of a series of picturebooks using Pinnell and Fountas’ (2007) text complexity framework to explore readers’ reading practices and comprehension of those texts using Miscue Analysis (MA) and eye movement data to identify areas of complexity and challenge. Those insights provided greater understandings about the ways readers engage with authentic texts (such as picturebooks), and hence the need for more comprehensive frameworks for understanding text complexity as educators select resources for reading teaching and assessment.
Literature Review
Miscue Analysis [MA]
Eye Tracking Technology and its Applications in Reading Research
Eye Movement Miscue Analysis (EMMA)
While EMMA studies have informed the field about readers’ strategies and practices as they process texts. However, little is known about the nature of the text itself. The novelty of this study is the use of EMMA to investigate text complexity. This study shifts the focal point to become the text itself, as the diverse responses from readers help shed light on text complexity through what readers do (process) and understand (retell). Examining how readers are positioned by the texts they read, that is, their complexity, can offer fresh insights that could respond to some of the enduring puzzles about reading.
Methodology
Research Design
The study drew on an archive of picturebook reading captured through audio and eye-movement data obtained from primary school children ages 7-11 years old. Data were collected at a public primary school in New South Wales, Australia, where teachers used standardised reading assessments to track and group students based on their reading proficiency. Thirty students were recruited, all of whom had been identified through their teachers' classroom reading assessments as demonstrating reading proficiency below the expected levels on benchmark assessments.
The complexity of a selection of texts (picturebooks) commonly used in Australian primary school classrooms was examined using Pinnell and Fountas’ (2007) text complexity guide. The complexity guide uses qualitative measures for evaluating text complexity and therefore its perceived ‘difficulty’ based on sentence structure, vocabulary, and content. The goal was to match a suitable picturebook with the identified reading proficiencies of the participating children (Figure 1).
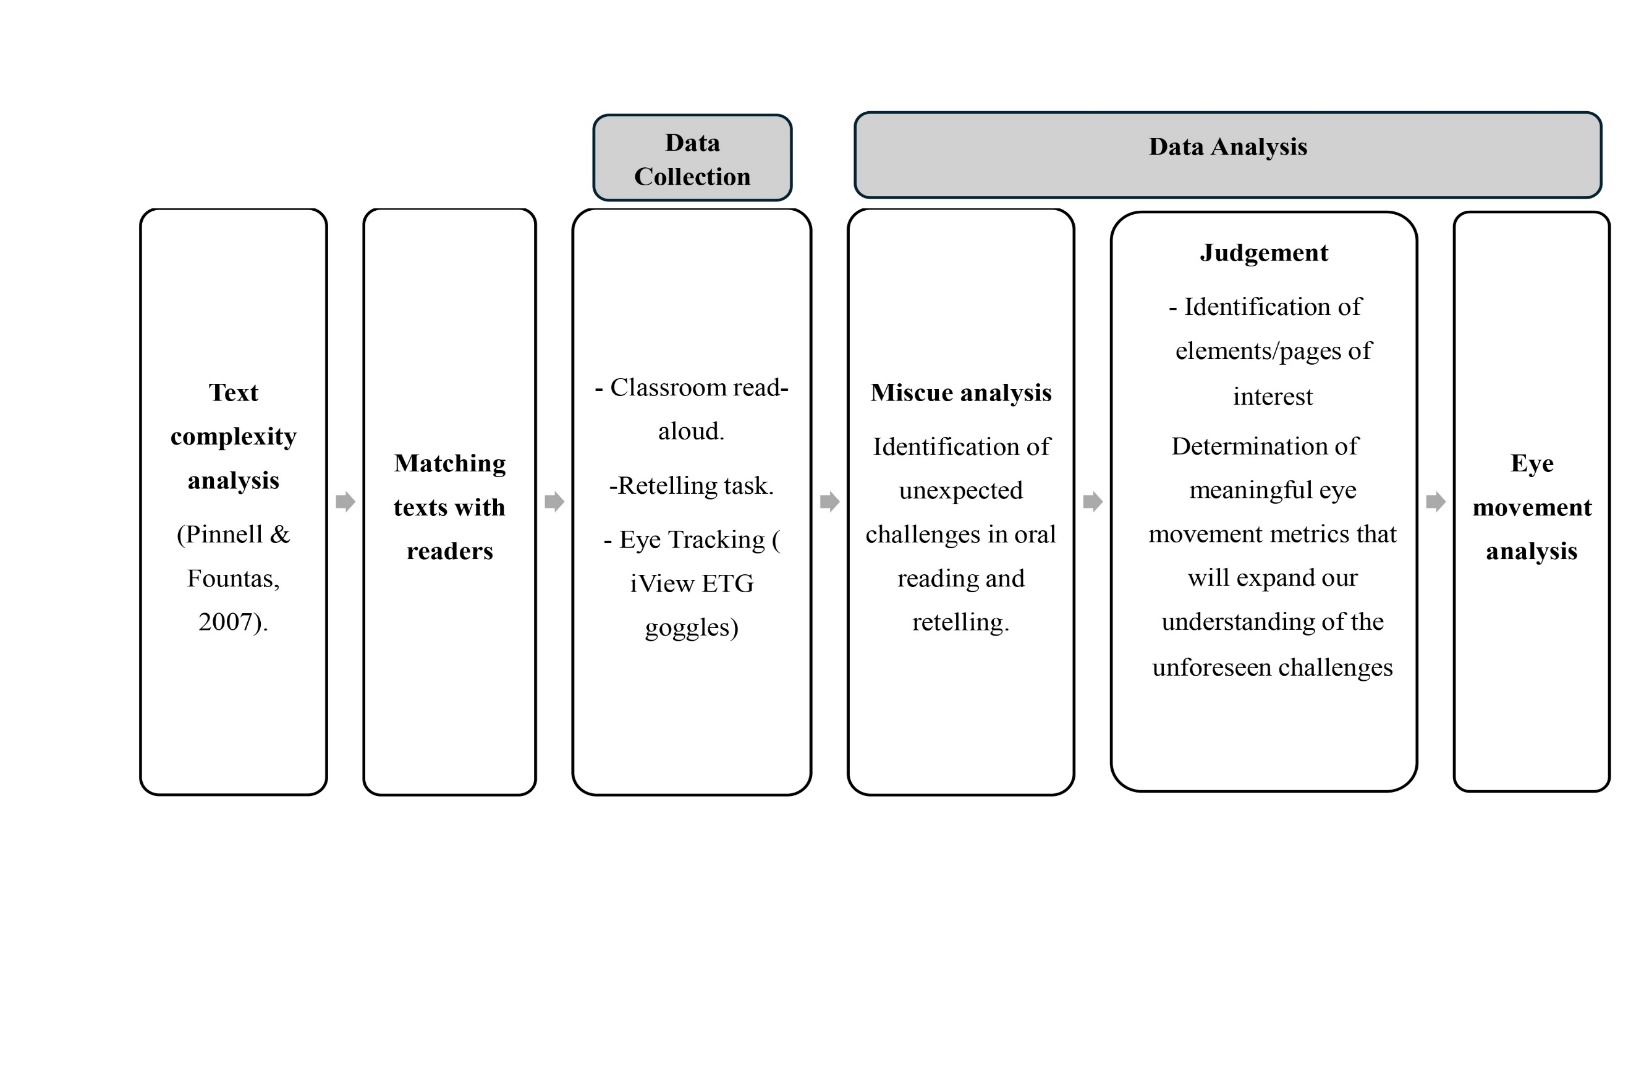
Figure 1. Research Design
Data Collection Procedures
Data were collected in the participating children’s classrooms as they read selected picturebooks while wearing the iView ETG video-based eye-tracking glasses. The eye-tracking glasses were chosen over screen-based eye trackers to allow for a more natural reading experience, as they enable participants to engage with physical picturebooks in their regular classroom environment adding ecological validity to the research. Technical details about sampling rate, calibration, and software are provided in Appendix A.
The children sat in a comfortable position in or near their classroom alongside one researcher under standard classroom lighting. Using MA protocols, they were asked to: 1) read just as they would when reading independently, but out loud so the researcher could hear; 2) retell the story in their own words (unaided retell) as a demonstration of their reading comprehension; and 3) respond to prompting questions (aided retell) designed to prompt for more information about the reader’s understanding. These questions and prompts relate to specific details, plots, and events, as well as interpretations and inferences about the content. The researchers used audio recordings of the reading and retelling to prepare a miscue analysis for each child’s reading of each text. Each reading session lasted approximately 20 minutes, and data collection took place over a period of six weeks.
Focus Text and Participants
My Uncle’s Donkey is a third-person narrative about a donkey living in a house and engaging in human-like activities, creating a juxtaposition between cultural norms and unusual pet choice. Each double page presents one sentence in one to two lines. Each typically starts with the phrase ‘My uncle's donkey…’ and ends with an event or activity it likes to do. Examples include watching TV, talking on the phone, and juggling. The donkey and the uncle are prominently displayed in the centre of most pages, set against a white background that makes the characters and their actions stand out.
The words in My Uncle’s Donkey are enhanced by the illustrations (Nikolajeva & Scott, 2000), that is, expanding on the story through emotional and interpretive layers not explicitly mentioned in the written text. While the writing primarily describes actions and locations, this picturebook uses images to convey emotions, power dynamics, and characters’ interactions. For example, one sentence states, ‘My uncle’s donkey likes to hide’, however an illustration of the donkey’s feet, legs, and ears absurdly sticking out from the curtain shows the donkey to be poor at hiding, expanding the reader’s understanding of this character (Sipe, 1998). The uncle, who is not an active character in the story, is often depicted gazing away from the donkey rather than interacting with it, suggesting he might ignore its strange behaviour or is perhaps unaware of his existence (Figure 2). The richness of this text (Ewing, 2020) is developed as ideas, emotions, and insights into the human condition are conveyed through multiple modes.
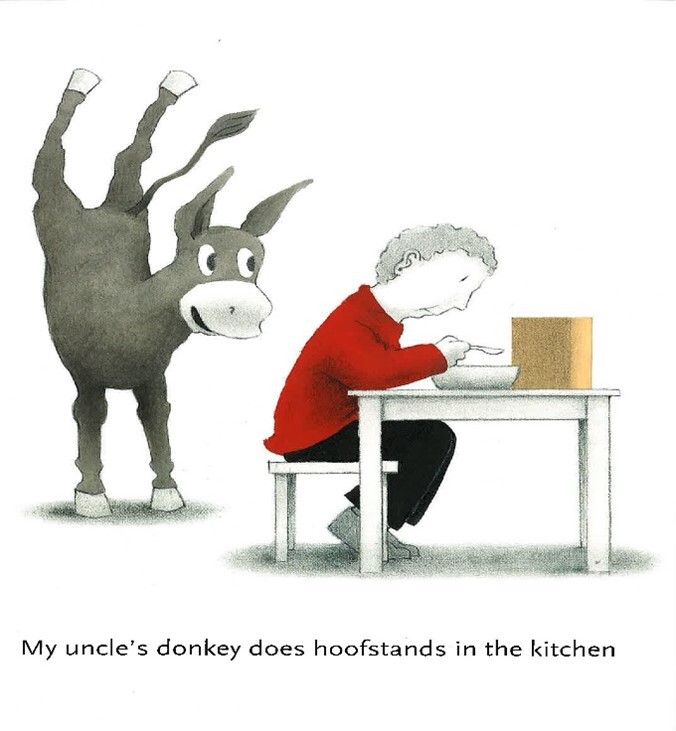
Figure 2. My Uncle’s Donkey (Riddle, 214, p.6)
Data Analysis
The study employed an exploratory sequential design (Creswell, 2014), beginning with the collection of qualitative (MA) then quantitative data (EM). Qualitative data (transcripts from the read aloud and retell) were analysed to identify the nature of readers’ miscues with a particular focus challenges not anticipated through the complexity analysis (Pinnell & Fountas, 2007) (Appendix B). Subsequently, a judgement was made to identify pages or elements of interest and determine the meaningful metrics that could shed light on the nature of these unanticipated challenges. Eye movement (EM) data were analysed on these identified areas of challenge to understand how readers navigate complex areas of the text. Figure 3 illustrates the study’s sequential analysis approach to examining picturebook complexity.
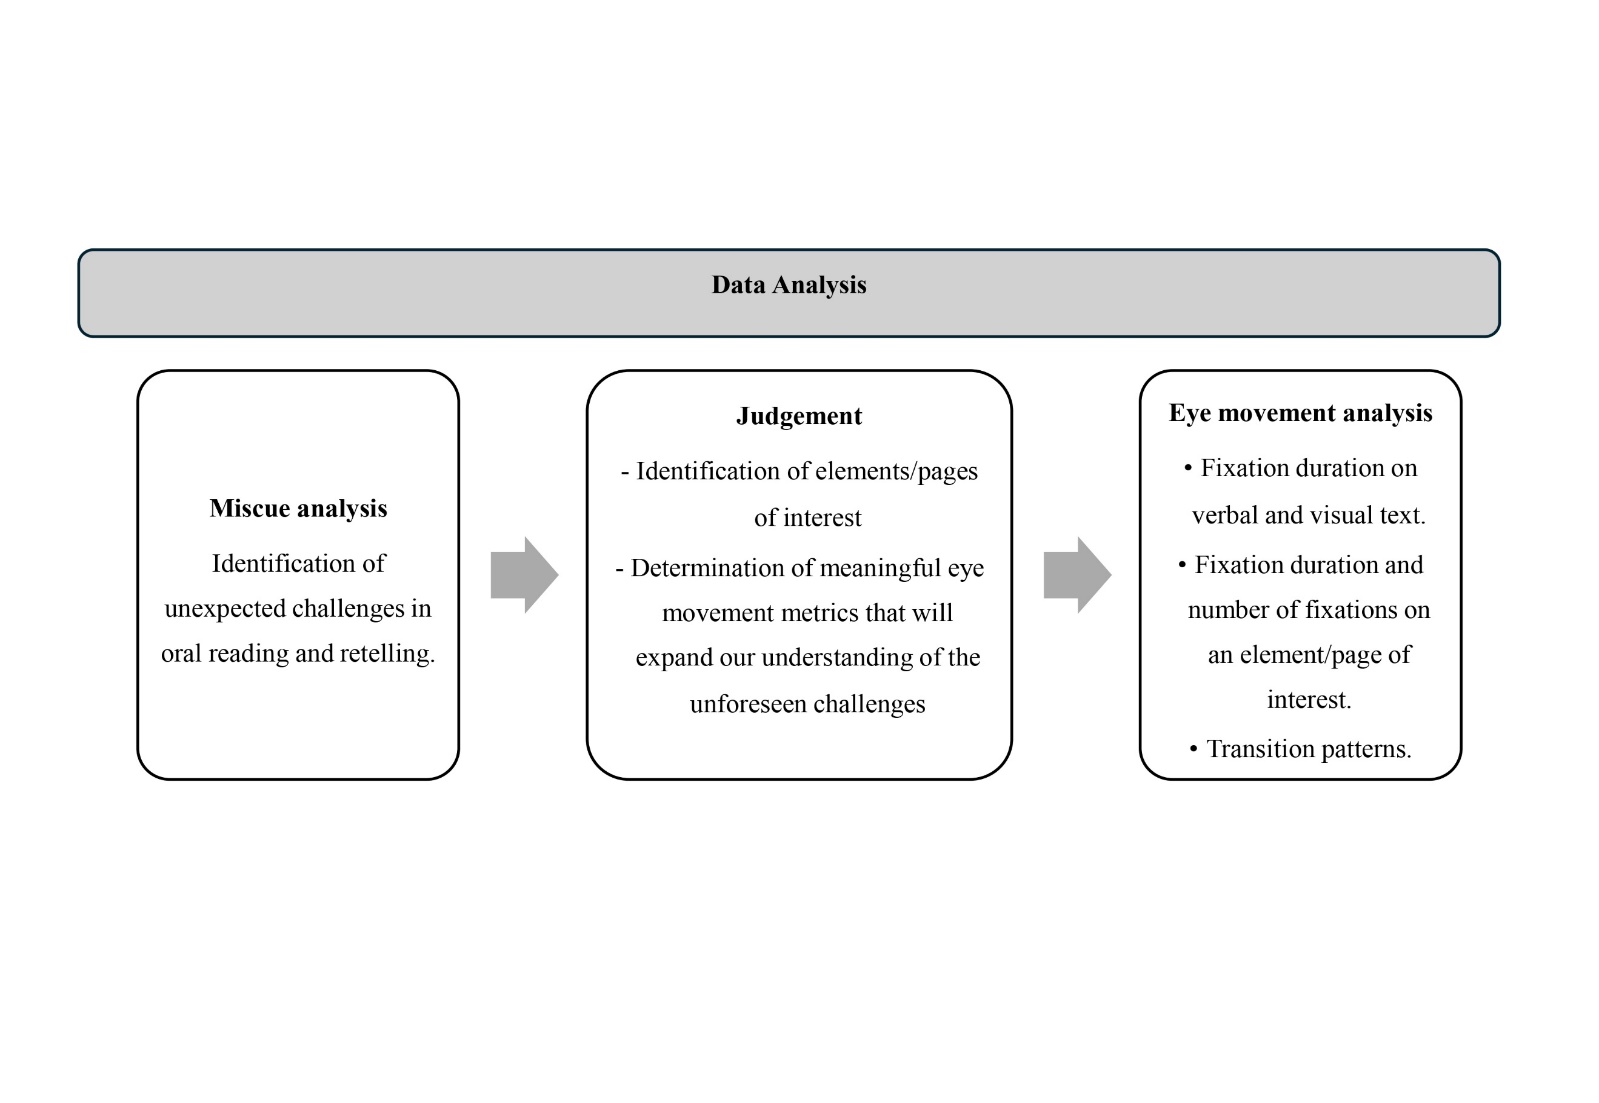
Figure 3. Data Analysis - A Sequential Approach
Miscue Analysis
The Reading Miscue Inventory (RMI) drove the Miscue Analysis assessment (Y. M. Goodman et al., 2005). To ensure reliability, the researchers listened to the recordings of both reading and retell multiple times and collaboratively constructed miscue analyses. All miscues were listed in a coding form and numbered, including substitutions, omissions, insertions, and intonations that affect the meaning, even if self-corrected (Appendix C). Following coding, a qualitative miscue analysis was conducted to rank the miscues against Y. M. Goodman et al.'s (1987) six categories: syntactic acceptability, semantic acceptability, meaning change, correction, graphic similarity, and sound similarity (Appendix C). Then, patterns of interrelationships between responses were calculated (Appendix C) along with reading grades in response to the patterns formed, providing statistical data alongside the qualitative data (Appendix D). Analysis of miscues culminated with the retell where key points in the story were identified.
Eye Movement Analysis
Results of miscue and retell analysis led to the identification of specific pages where unanticipated reading challenges warranted further investigation. While all 10 readers were initially included in this stage of analysis, data from two were excluded due to poor eye-tracking quality and one was excluded due to insufficient data (missed more than 50% of the target pages). For the specific pages, three analyses were conducted for each individual: 1) distribution of fixations on written, visuals, and other white space on the pageto assess the overall attention devoted to written and visual elements, 2) frequency (total number of fixations) and duration of overall fixations on key elements/page of interests to examine the level of focus on these elements 3) origins of eye movements (fixations) that land on key elements; to determine what prompted readers to look at that element. These analyses were used to characterise readers’ visual attention patterns and how they engage with specific elements of the text.
Results
Miscue Analysis
Participants’ miscues were analysed and categorised, with rates calculated per hundred words (MPHW) to assess reading accuracy and are presented in Table 1. Percentages are included to highlight trends and patterns of participants’ individual reading processes rather than to support generalisations across participants. Details on how these percentage were computed are provided in appendix C and appendix D.
| Reader | Grade | TotalMiscues (MPHW) | Meaning Construction | Grammatical Relations | Graphic Similarity | Sound Similarity |
| Hana | 3 | 1% | 100% | 100% | 50% | 50% |
| Darby | 3 | 2% | 90% | 100% | 100% | 100% |
| Kaidon | 3 | 5% | 81% | 100% | 56% | 42% |
| Karina | 3 | 2% | 75% | 100% | 66% | 66% |
| Tegan | 2 | 2% | 75% | 75% | 50% | 50% |
| Joash | 3 | 14% | 32% | 41% | 65% | 56% |
| Leonardo | 2 | 14% | 25% | 33% | 70% | 70% |
| Vish | 2 | 26% | 15% | 33% | 70% | 70% |
| Klay | 2 | 40% | 11% | 66% | 16% | 8% |
| Audery | 2 | 53% | 3% | 15% | 75% | 75% |
Among the ten readers, two demonstrated accurate reading, three maintained meaning at a level of 80-75%, and the remaining five maintained meaning at a level of 32-3%. These findings broadly aligned with Pinnell and Fountas' (2007) complexity analysis, which had predicted challenges with multisyllabic words in the text, for example, ‘favourite,’ ‘business,’ ‘hoofstands,’ and ‘cartwheels.’ A notable pattern was readers pausing when encountering challenging vocabulary, often rereading the sentences, and attempting to rely on graphic cues. However, several readers abandoned correction, omitted the challenging vocabulary, and resumed reading.
Unaided and Aided Retell
While six readers produced elaborate retellings of the story, four offered briefer summaries. Common across these retellings, however, was the challenge of identifying the characters, specifically the uncle. The uncle is depicted on the cover page and ten times throughout the text in a red sweater (e.g., see Figure 2), and his relationship with feelings about his donkey are mainly conveyed through visuals. Despite this, most readers could not recognise the uncle, were confused about who was telling the story, and whether the uncle was even in the story. For example, Readers 1 and 3 were unsure who the human character was, while Reader 2 believed the uncle was not present in the story at all. Consequently, they missed some important and nuanced information about the characters and the plot. The following examples demonstrate the readers’ confusion about the uncle character.
Example from reader 1: confusing the uncle in the illustrations with the story’s narrator
Researcher: Who else is in the story?
Reader 1: The person
Researcher: Tell me about the person.
Reader 1: That he ummm he’s talking.
Researcher: What do you mean he’s talking?
Reader 1: That he’s saying the ummmummmummm words.
Example from reader 2: Prompting did not help readers recognise the character.
Researcher: My uncle’s donkey. What’s an uncle?
Reader 2: He’s really old.
Researcher: Is the uncle in the story?
Reader 2: No.
Researcher: You don’t see the uncle?
Reader 2: Nope. And yes that guy is the uncle.
Researcher:Ohh. Could that be?
Reader 2: No.
Example from reader 3: He remembered the uncle's illustration and made inferences about his personality, but was unable to identify him from the text.
Reader 3: There was a donkey and there was a person in the background … it didn’t really talk about the person. … And they talked a lot about the donkey … yeah and there were pictures and yeah.
Researcher: Tell me about the person in the background.
Reader 3:Well he didn’t like the donkey
Researcher: How do you know he didn't like him?
Reader 3: About his face
Researcher: What about his face?
Reader 3: He didn’t … hold on, let me look at the book. [Pointing towards the book] look at his face. It’s grumpy.
Researcher: Oh, he has a grumpy face. And who do you think that is?
Reader 3:uhhh. … the uncle. No. The uncle’s son … I think. [extended pause]
The miscue analysis and retellings suggest a disconnect between the challenges predicted for these readers in the text’s complexity analysis (Appendix B) and the readers’ actual interaction with the narrative. Despite clear illustrations, many readers struggled to recognise or understand the uncle’s role in the narrative. This points to possible gaps in how visuals are interpreted and used during reading. To further explore these challenges, eye movement data were examined.
Eye Movement
The uncle appears on ten of the thirty pages, typically wearing a red sweater. Despite this visual prominence, the textual reference to the uncle is minimal. Responding to unexpected difficulties in identifying the uncle, analysis of eye movements was undertaken on the ten pages featuring the uncle’s illustration. These pages take a consistent format – a large centrally positioned illustration on a white background with a sentence or sentence fragment on each, typically located at the top of the page (Figure 4).
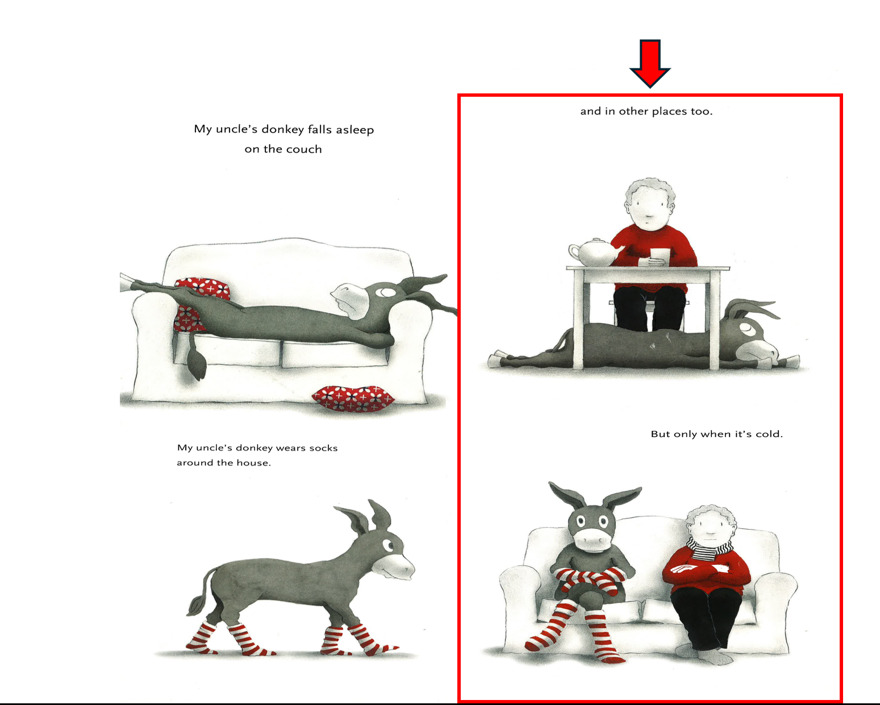
Figure 4. Uncle's Appearances in Diagram: 10 out of 30 Pages (Riddle, 2012)
Distribution of Fixation Duration Across the Pages of Interest
All seven readers showed eye movements that indicated they engaged with the visuals. Fixation durations for the pages of interest are summarised in Table 2, with durations categorised by written text, visuals, or other white space on the page. Overall, the readers devoted some (21.3%) of their visual attention to visuals (range: 9% to 34%), and most to written text (average 76.1%; range: 61% to 86%). This suggests a wide range of individual variability, with a general preference for written text over visuals, but all readers engaged with the visuals.
| Reader | Total Fixation Duration10 Pages of Interest(in milliseconds) | Fixation Duration by Category (in milliseconds) | ||
| Written Text | Visuals | Other White Space | ||
| Hana | 26398.2 | 18738.5 | 7659.7 | 0 |
| Darby* | 38950.5 | 30713.3 | 6889.7 | 1347.5 |
| Kaidon | 46917.3 | 36735.1 | 9982.4 | 199.8 |
| Karina* | 22413 | 13709 | 7621 | 1083 |
| Joash* | 38667.8 | 32578.5 | 3410.6 | 2678.7 |
| Vish | 219892.6 | 189060.1 | 28303.4 | 2529.1 |
| Audery* | 74681 | 55370.6 | 18944.5 | 365.9 |
Note. An asterisk (*) indicates that the reader skipped 1-2 pages of the targeted 10 pages during reading or that fixation data were lost due to head movements during the reading of the picturebook
Fixations and Fixation Duration on the Uncle
Fixations and overall fixation durations specifically on the uncle were further examined and are reported in Table 3. All readers fixated on the uncle’s illustration at least four times. during their reading. However, individual differences were evident in the frequency and duration of fixations. Number of fixations on the uncle ranged from 4 to 30 throughout the reading, and the total fixation duration on the uncle varied from 964.7 milliseconds to 9451.2 milliseconds, highlighting individual differences in children's attention to this specific character.
| Visuals | Visuals – Uncle | |||
| Reader | Number of Fixations | Fixation Duration [ms] | Number of Fixations | Fixation Duration [ms] |
| Hana | 37 | 7659.7 | 11 | 2444.4 |
| Darby | 38 | 6889.7 | 15 | 2629.3 |
| Kaidon | 40 | 9982.4 | 8 | 1629.5 |
| Karina | 18 | 7621 | 10 | 3128.9 |
| Joash | 20 | 3410.6 | 4 | 964.7 |
| Vish | 119 | 28303.4 | 30 | 7589.3 |
| Audery | 70 | 18944.5 | 24 | 9451.2 |
Transition Patterns
To better understand the context in which the readers engaged with the uncle’s illustration, the origins of transitions (fixations) to the uncle's illustration were identified. These transitions were categorised as follows: before fixating on any written text on the page; after reading written text on the page; after reading a specific word or phrase; or as a potential aid in word identification (determined by analysing eye-tracking data alongside audio recordings) (see Figure 5).
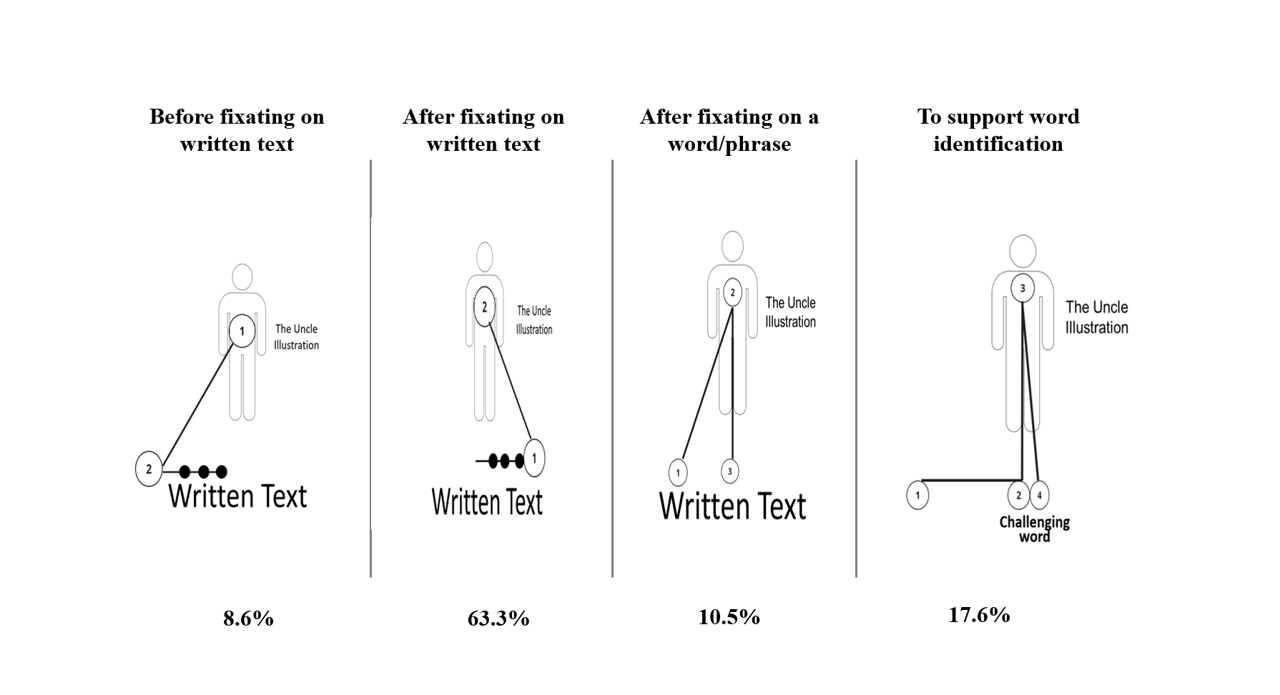
Figure 5. Transition Patterns Involving the Uncle’s Illustration
Most transitions (83.22%), as detailed in Table 4, occurred before reading the corresponding text, after reading a complete page, or after reading a phrase/word. This suggests that the uncle’s illustration was strategically used to support meaning construction, rather than simply as a visual aid for word decoding.
| Visuals – Uncle | Number of fixations based on type of transition | |||||
| Reader | Number of Fixations | Fixation duration | Before written text | After written text | After a word/phrase | To support word identification |
| Hana | 11 | 2444.4 | 10 | 1 | ||
| Darby | 15 | 2629.3 | 1 | 13 | 1 | |
| Kaidon | 8 | 1629.5 | 2 | 5 | 1 | |
| Karina | 10 | 3128.9 | 9 | 1 | ||
| Joash | 4 | 964.7 | 3 | 1 | ||
| Vish | 30 | 7589.3 | 5 | 9 | 4 | 12 |
| Audery | 24 | 9451.2 | 5 | 5 | 6 | 8 |
The eye-tracking analysis reveals that while readers did fixate on the uncle, their engagement with that illustration varies significantly in terms of the number of times they visited/revisited this visual information and the duration of these fixations. However, the time spent on both the written and visuals, as well as the patterns of transitions to the uncle’s illustration, suggest that readers primarily utilised this explicit illustration to supplement and reinforce textual information. Interpretive commentary on these findings is elaborated in the discussion section.
Discussion
The guide priorities linguistic elements, such as sentence structure and vocabulary, but does not account for the interpretive effort involved required to integrate visual and textual modes.
Conclusion
This paper demonstrates the capacity of eye movement technology alongside miscue analysis to capture the nuances of reading practices in natural settings, using authentic materials. It gives an example of the EMMA method to investigate text complexity and how it has the potential to add further depth, value, and new insights to already existing text complexity measures. Findings revealed that while students could decode written text accurately, many struggled to construct meaning when key narrative information was conveyed visually. Eye movement patterns showed a general preference for written text over visuals, yet transitions to visuals suggested a strategic effort to support comprehension.
This study addresses a significant gap in the literature by showing how EMMA can be used not only to examine reading strategies but also to reveal the demands embedded in texts, particularly multimodal texts, demands that current complexity frameworks often overlook and are difficult to examine in typical classroom reading assessment. It also highlights the significance of bringing multiple reading assessments together to inform understandings about how children make meaning with complex picturebooks, pointing to the need for more comprehensive ways to evaluate the interplay between written and visual information than is offered in existing approaches for evaluating a text’s complexity. Future research could extend this method to other types of texts.
Key Considerations
The Nature of the Selected Reading Materials and Reading Settings
Methodologies that use authentic readings resources, not contrived or edited, can provide insights into the real challenges of reading. Contrived texts typically feature direct, simple vocabulary and supplementary illustrations that may not reflect the complexity and diversity of authentic texts. Authentic texts expose readers to linguistic, cultural and visual diversity that can challenge their reading comprehension and skills. Moreover, collecting data in natural settings, such as classrooms, provides a more authentic and realistic picture of how children engage with texts. Although this may introduce variability due to distractions, it offers a more ecologically valid assessment of reading.
Layered Analysis Approach
Selecting an appropriate gaze metric that is aligned with the study’s purpose and offers novel insights is a crucial step in the data analysis. A layered approach can be adopted, starting with a miscue analysis, followed by an examination of gaze metrics relevant to the research. In this research, the appropriate gaze metric afforded meaningful data interpretations that led to a deeper understanding of a longstanding problem in reading research. The EMMA method here provided a view through readers’ eyes and a glance into their minds.
Recommendations
This study highlights the potential of Eye Movement Miscue Analysis (EMMA) to prompt a new focus on reconsidering the demands picturebooks pose for readers, even those deemed appropriate based on known text complexity guides. Understanding those demands is crucial for supporting reading development and instruction. Future research should investigate a wider variety of multimodal texts, including digital texts and nonfiction texts, incorporating diverse narrative structures and visual representations to explore how layout and navigation influence reader comprehension. The EMMA assessment method has much to offer with these investigations. Studies could also test this approach across diverse learner profiles, such as bilingual readers or students with specific reading difficulties, to understand how different readers interact with multimodal demands.
Additionally, while existing qualitative and quantitative measures offer valuable insights into textual complexity, they often fall short in capturing the nuanced complexities of picturebooks, as illustrated by participants’ engagement with My Uncle’s Donkey (Riddle, 2012). Future work could expand understandings of text complexity to go beyond textual elements to consider visual elements within the text. By examining how visual elements interact with, or separately from, written text, researchers can gain valuable insights into layers of complexity generated by interplay between these modes.
Limitations
While this study provides valuable insights into how less proficient readers engage with picturebooks, certain limitations also offer promising directions for future inquiry. The use of a small sample size and a single picturebook allowed for an in-depth, focused analysis, but these choices may limit the generalisability of the findings. The selected text, My Uncle’s Donkey (Riddle, 2012), provided a rich example of multimodal complexity but may not represent the full range of forms and narrative structures found in picturebook more broadly. Additionally, the participant group represents a specific reader profile, and future studies could extend this work by including readers with varied proficiency levels and backgrounds. These limitations are not only important to acknowledge but also serve to highlight areas where future research can further advance understanding in this field.
Ethics Statement
Ethical approval to conduct this research was obtained from the Human Research Ethics Committee at the University of Wollongong (Ethics code 2015/313).
Acknowledgments
Permission to use excerpts from 'My Uncle's Donkey' by Tohby Riddle (2012) was granted by Penguin Random House Australia for this research paper. The copyright for the book is held by Tohby Riddle. The national ARC Centre of Excellence for the Digital Child enabled collaboration across UOW and QUT to support the research
Conflict of Interest
The authors report there are no competing interests to declare.
Funding
Eye movement equipment was accessed through the Early Start Institute at UOW. The first author completed this research while supported by a PhD scholarship provided by Albaha University, Saudi Arabia.
Generative AI Statement
No generative artificial intelligence (AI) tools were used in the writing, analysis, or editing of this manuscript. All content is the original work of the authors. Where software tools were used for data management or formatting, these were standard, non-generative tools.
Authorship Contribution Statement
Alruthaya: Conceptualising, methodology, quantitative and qualitative data analysis, writing, and editing. Mantei: Supervision, conceptualising, data collection, and editing. White: Supervision, conceptualising, reviewing of quantitative analysis (eye movement), and editing. Kervin: Supervision, conceptualising, data collection, and editing.
Appendix A
Technical Specifications of Eye-Tracking Setup
Eye-Tracking Equipment:
- Device: iView ETG video-based eye-tracking glasses
- Manufacture: SensoMotoric Instruments (SMI)
- Sampling rate: 60Hz, binocular
Calibration Procedure
- A three-point calibration was conducted prior to each session to ensure accuracy of gaze data.
- Calibration was performed in the participant’s reading position, using printed calibration targets held in the participant’s filed of view.
Software Used
- Eye movement data were analysed using BeGaze software (Version 3.7).
- Analyses were conducted using the average position of both eyes.
- Fixations were classified using a minimum duration threshold of 80 milliseconds.