
Introduction
Effective vocal use enhances classroom communication, builds teachers’ confidence, and positively impacts students’ learning outcomes (C.-F.Hsu, 2012; Ilomäki et al., 2009). Yet, despite its central role in educator effectiveness, voice is often overlooked in teaching practice. Lecturers who develop awareness of their vocal qualities, recognizing both strengths and limitations and understanding their influence on classroom dynamics, are better positioned to engage students, create a supportive learning environment, and achieve sustained professional success. Given that oral presentations remain the most commonly used teaching method, they place considerable demands on vocal performance (Prados-Bravo et al., 2024). To meet these demands, a teacher’s voice must be clear, engaging, motivational, and assertive, while maintaining long-term vocal effectiveness (Järvinen et al., 2024). A monotonous, weak, or tense voice, as well as deviations in speech speed and fluency, can undermine the teacher's ability to capture and sustain students' attention (Ahlander et al., 2012; Ramma, 2009). In this context, the voice is an indispensable tool for teaching, and its optimal functioning is a fundamental requirement for effective communication and professional performance (Hazzam& Wilkins, 2023; Huang & Lin, 2014).
Furthermore, voice is a primary channel through which lecturers convey charismatic qualities. Charisma has been defined as “values-based, symbolic, and emotion-laden leader signaling” (Antonakis et al., 2016), where signaling refers to the active or passive cues that individuals emit, shaping others’ perceptions. These cues may stem from the content of a person’s ideas and words, their visual appearance, or their vocal delivery (Klofstad et al., 2012; Lombardi et al., 2020). Since Weber’s (1947) initial characterization of charisma as an “extraordinary quality,” research has evolved toward a more practical focus on identifying the specific skills and behaviors that elicit perceptions of charisma (Antonakis et al., 2016). Importantly, charisma is a perceptual construct, attributed by observers based on the interpretation of particular behaviors or traits (Howell & Shamir, 2005), where aspects of a person’s manner of speaking or style can lead others to ascribe to them qualities associated with charisma (D’Errico et al., 2013; Shavit et al., 2025). In the educational context, these subtle yet powerful perceptions of charisma can play a crucial role in attracting students to their lecturer and influencing their engagement. However, although charisma has been extensively studied in leadership research across various contexts, such as business and politics (Antonakis et al., 2016; Hildebrand et al., 2020;Klofstad et al., 2012), its role in classroom leadership has received less attention. The qualities of lecturers that inspire, build trust, and evoke learning in students may share similarities with those of leaders who influence larger groups.
In addition, artificial intelligence offers considerable potential for enhancing the skills of both lecturers and students. In recent years, machine learning (ML) has been employed to infer general personal traits from voice (e.g., Mehta et al., 2020; Schuller & Batliner, 2013). Building on this work, the present study applies ML to lecturers’ voices to identify acoustic cues associated with charisma, offering a reliable and efficient means of quantifying vocal dimensions relevant to charismatic delivery (Aharonson et al., 2023). Importantly, contemporary ML algorithms can not only predict personal traits (Jha et al., 2022) but also identify the specific attributes that drive these predictions. This study leverages this capability to gain empirical insights into the measurable vocal characteristics of charismatic lecturers. Furthermore, given that certain vocal attributes are gender-specific (Lausen & Schacht, 2018), perceptions of charisma may differ according to both the lecturer's and the listener's gender, differences that are explicitly examined here.
Hence, the current study offers four main contributions to the literature. First, we dedicate our study to the charisma of lecturers as perceived by students. Secondly, we provide an embodiment perspective that can explain how perceptions of a charismatic “aura” arise from a lecturer’s voice cues. Thirdly, we portray the feasibility of using ML to learn the subtle characteristics of a lecturer’s charisma, and to show that lecturers perceived as charismatic exhibit different vocal profiles from those perceived as less charismatic. Lastly, we investigate whether the lecturer’s gender shapes these charismatic voice attributes and whether they are perceived differently by male and female students.
Literature Review
The Charismatic Voice
While the primary focus of a lecture is its content, the manner of delivery plays an important role in ensuring effective communication. Specifically, delivery factors, such as prosody and charisma signals, can impact students’ engagement, comprehension, and retention of the material (e.g., Huang & Lin, 2014; Lin & Huang, 2016). Lecturers who excel in utilizing prosodic charisma signals enhance student learning outcomes and the overall classroom experience (Fischer et al., 2021; Niebuhr et al., 2016).
Intricate physiological mechanisms combine to produce the acoustic properties of the human voice. These properties are the patterns of sound fluctuations formed by modifications applied to the flow of air originating in the lungs. This flow is first modified by the vibration of the vocal cords in the larynx that creates sound waves, which are the basis of speech. As the air continues to flow upward, it passes through the vocal tract, where the configuration of the jaw, tongue, lips, and teeth further shapes the sound. The velum, or soft palate, then opens or closes the passage to the nasal cavity and adds the nasal quality to sounds. Focusing on the non-verbal attributes of speech, the literature on prosody traditionally focuses on the pitch, rhythm, and loudness of the human voice, which collectively contribute to the flow and expressiveness of spoken language (Scherer et al., 2003). The pitch represents the rate at which the vocal folds vibrated during phonation. Loudness is a perceptual measure of the intensity or power of an audio signal, and the term “rhythm” refers to the temporal patterns and variations in speech (Schuller & Batliner, 2013).
Embodiment theory (Niedenthal, 2007; Reh et al., 2017) posits that cognition is grounded in sensory and motor experiences, with individuals understanding the world—and others—through the simulation of physical and emotional states. This perspective extends beyond abstract reasoning, emphasizing that perceivers partially “experience” another person’s state through embodied processes. Applied to vocal communication, embodiment theory offers a framework for understanding how a lecturer’s vocal cues—such as a confident tone, dynamic pacing, or warm pitch—can evoke automatic bodily and emotional responses in listeners (Barsalou, 2008). These embodied reactions, in turn, influence listeners’ perceptions of the lecturer’s personality, intent, and, ultimately, their charisma. A large body of literature indicates attributes that quantify and describe vocal properties in the context of the speakers’ traits and their listeners’ perception. For example, vocal attributes have been found to contribute to specific behavioral constructs, such as confidence and persuasion (Gussenhoven& Chen, 2021;Mitchell & Ross, 2013). These findings suggest that even subtle aspects of voice can lead students to attribute key elements of perceived charisma to the lecturer (Gregory & Gallagher, 2002;Pearsell& Pape, 2023). Higher levels and a larger variability of pitch, loudness, and rhythm have been associated with charismatic speakers (Niebuhr et al., 2016). Specifically, characteristics of voice loudness (the mean loudness level and standard deviation), and voice rhythm (the frequency of emphatically stressed words, disfluency counts, and prosodic-phrase durations), were negatively correlated with perceived speaker charisma (Hiroyuki & Rathcke, 2016; C.-C.Hsu et al., 2024; Niebuhr et al., 2016; Scherer et al., 2003). However, the quantification of lecturers’ charismatic vocal attributes and students’ perceptions of charisma has received little attention.
Charisma, Voice, and Gender
The acoustic attributes of a charismatic voice may be associated with gender, reflecting differences in anatomy and physiology between males and females. Male bodies are larger on average, and the size of the larynx is a secondary sexual characteristic partly controlled by testosterone levels. The larger the larynx, the longer and thicker the vocal folds and the lower the pitch of the voice (Hildebrand et al., 2020; Signorello et al., 2020). Moreover, gender is associated not only with the way we speak but also with the way we hear each other. Studies on vocal preferences consistently demonstrate that pitch influences listeners' perception of speakers. Women generally favor lower-pitched male voices, which are often associated with physical strength, authority, and dominance, and men typically prefer higher-pitched female voices, linked to youthfulness and warmth (Collins, 2000; Feinberg et al., 2005, 2011; Hildebrand et al., 2020; Hughes et al., 2010; Weiss et al., 2021). These trends, documented across different linguistic and cultural contexts, suggest that vocal pitch operates as a socially and biologically salient signal. Although much of the existing research on vocal perception originates from interpersonal or mate-selection contexts, the underlying perceptual mechanisms are equally applicable to educational settings, where students may unconsciously use similar evaluative criteria when assessing lecturers. Evidence indicates that male and female speakers are perceived differently based on charisma-related vocal cues (Pearsell&Pape, 2023; Puts et al., 2007;Quenéet al., 2016). For instance, a comparative analysis of acoustic–melodic charisma attributes among male and female business executives found that female CEOs—perceived to possess charisma levels comparable to their male counterparts—displayed more frequent and stronger acoustic charisma cues. They used emphatic accentuation more often, hesitated less, and exhibited higher average acoustic energy and speaking rates than male CEOs (Novák-Tót et al., 2017). Other studies suggest gender-specific pitch effects: men tend to sound more charismatic when raising their pitch, whereas women are perceived as more charismatic when lowering theirs (Hildebrand et al., 2020). Similarly, charisma in male speakers has been associated with faster speaking rates, while in female speakers it has been linked to slower speaking rates (Feinberg et al., 2011). It should be noted that most of the studies on voice characteristics and charisma have focused on speech spoken by men. However, in the educational context, many lecturers are female; thus, significantly more research is required on female speakers and their listeners. Another limitation of studies on charismatic speakers, in general, and those of male and female speakers in particular, is that they have not provided the relative importance of each individual vocal attribute or a group of vocal attributes in charisma recognition. Widely used ML algorithms can identify and rank specific attributes that are most important for the recognition of a phenomenon, out of a large number of attributes. Applied to voice, they can rank individual and grouped vocal attributes and estimate each one’s contribution to perceived charisma.
To summarize, earlier studies have not provided a conclusive or quantitative model to explain how speech cues trigger perceptions of a lecturer’s charisma. The differences between male and female students’ perceptions of male and female lecturers’ voice attributes remain similarly inconclusive. To further our understanding of these issues, the current study explores how lecturer–listener gender combinations moderate the relationship between specific vocal charisma cues and learners’ perceptions of lecturer charisma.
Computerized Description of the Charismatic Voice
Contemporary voice studies often use computerized analyses of voice characteristics. The analysis typically includes two steps: 1. an automatic extraction of voice attributes from speakers’ voices, and 2. a machine learning model (ML) that uses these attributes to predict human ground-truth ratings of the characteristics.
Progress in speech-processing technology for speaker profiling and emotion recognition now provides automated tools to extract an extended set of thousands of quantitative variables that describe, among others, the properties and dynamics of pitch, loudness, and rhythm (Schuller et al., 2013). Earlier computerized analyses summarized pitch, loudness, and rhythm using simple descriptive statistics (means, standard deviations, ranges, maxima, minima; e.g., Niebuhr et al., 2016). Current tools extract finer-grained distributional and temporal features that capture how high and low values unfold across an utterance (Aharonson et al., 2023). Specifically,OpenSMILE®Emobasetoolbox (Eyben et al., 2010) is an extensively used toolbox that extracts acoustic attributes for emotive speech characterization. The tool extracts speech properties such as pitch, rhythm, and loudness over an entire speech input by measuring their values in subsequent small windows throughout the duration of the input. The tool also provides statistical functions, such as quantiles, kurtosis, and regression coefficients, that can capture multiple aspects of how these properties of speech vary over time (Puts et al., 2007).
ML algorithms require data and a target (response) variable to learn patterns in the data that could gain a deeper understanding of its properties (Charte et al., 2019). The data in charismatic speech studies comprise a set of acoustic attributes from the speakers’ voices, along with the target variable of human-rated charisma levels (Aharonson et al., 2023). Importantly, current explainable ML methods, such as the Random Forest algorithm, can list the key attributes that contributed to their prediction and rank them according to importance (Breiman, 2001; Scornet et al., 2015). The ranking thus determines which of the speech attributes are relevant to explaining the charisma target variables and quantifies the extent of their relevance. The Shapley (SHAP) values representation (Lundberg & Lee, 2017), is an increasinglyrecommended method for attribute-importance evaluation. These values explain machine learning models in an interpretable, theoretically consistent, and robust manner. The SHAP method calculates an importance index, of values between 0 and 1, for all the attributes. The higher the index, the greater the attribute's influence on the prediction. However, the interpretability of the SHAP-based attribute importance analysis inherently relies on the Random Forest model first demonstrating accurate predictive performance. Prediction accuracy is assessed by evaluating the model with new data - the test data - that the model has never encountered during training. This approach ensures the model’s ability to generalize and to provide reliable predictions on future or unseen data. A common method for reliably estimating prediction accuracy is nested cross-validation(Poldrack et al., 2020). This technique repeatedly divides the dataset into multiple parts. The model is trained on most parts and then tested on a part that was left out. Within each training round, further internal cross-validation is performed to choose the best model setting. The reported accuracy is the average of the test results across all the left-out parts. Specifically, accuracy is calculated using a confusion matrix, a table that compares model predictions with the actual target variables. Correct predictions, represented by the diagonal elements of the confusion matrix, are those cases where predicted and actual charisma ratings align. From this table, one can calculate the accuracy, which indicates how often the model's predicted charisma ratings align with the actual ratings provided by human evaluators (Krstinićet al., 2020). A reliable prediction, coupled with attributes ranking, can thus provide a fuller and more interpretable description of the relative importance of voice attributes to charisma (Rudin,2019).
These methods establish the maturity of computational speaker trait modeling. Recent systematic review confirms, however, that while computational and interpretable ML techniques have achieved significant success in modeling speakers' emotional valence, likability, and leadership potential, charisma has not been a primary target of such computational frameworks (Zhao et al., 2022). This underlines the novelty of our contribution:we provide an empirical study to demonstrate the feasibility of extending such frameworks to context-specific constructs, specifically classroom charisma.
Methodology
Sample and Data
Two hundred publicly available YouTube videos of academic lectures delivered and videotaped in class in front of students were sourced. The lecturers consisted of 100 males and 100 females, and the lectures covered various topics in the humanities, social sciences, and natural sciences. The query used the search words: “college lecture,” “university lecture,” and “academic lecture,”. From each, the first 500 results, sorted by YouTube's default relevance, were retrieved. The selection process included only lectures delivered in English, by American lecturers, made no exclusions based on age or other restrictions, and admitted only videos with high audio quality as provided by YouTube’s API. Manual coding was then used to exclude recordings that did not show an instructor speaking to students in a classroom, and the speaker's gender was coded accordingly. Following these exclusions, we randomly drew without replacement 100 videos from the male lecturers' sample and 100 from the female one. Next, three-minute segments were randomly cropped from the videos. The segments were processed using Bash scripts to separate the audio and video components. Thus, the dataset comprised 200 audio files, each containing a 3-minute audio segment from a video.
Subsequently, 900 students from an international university were recruited to participate in the study as a partial fulfillment of their Introduction to Psychology class. All the procedures described below were carried out under relevant guidelines and regulations, and the experimental protocol was approved by the first author’s institutional ethics committee. The participants signed an informed consent form, listened to audio segments, and evaluated the lecturers using charisma questionnaires (Pisanski et al., 2012). The participants reported their gender, with 51.6% identifying themselves as males (mean age = 24.19 years, SD = 2.26) and 48.4% as females (mean age = 22.87 years, SD = 2.16 years). The participants’ overall mean age was 23.66 years (SD = 2.63 years). They also provided a self-report measure of their level of fluency in English (33% were native English speakers, 50.6% reported high fluency, and 15.7% reported intermediate English fluency). Each participant listened to five randomly selected audio files, and each speaker’s audio file was assessed by 8–14 listeners (mean = 11.35, SD = 1.3).
Upon arriving at the lab, the participants were given a link to a Qualtrics questionnaire created for the study. They worked on the lab PC wearing headphones. On the first screen, they read the instructions, were guaranteed anonymity, and provided consent. Next, they listened to a three-minute audio clip from a lecture and then answered the two charisma-rating questionnaires about the speaker in the recording. This sequence was repeated for five audio clips. The duration of this experimental session was approximately 20 minutes. The two charisma questionnaires used a 5-point Likert scale ranging from 1 - “Not at all” to 5 - “Frequently, if not always”). The first questionnaire was the General Charisma Inventory (GCI,Tskhayet al., 2018). The GCI includes 6 items that focus on the speaker’s perceived influence and affability, for example, “The person you have just heard has the ability to influence people”, and “That person makes people feel comfortable”. The second questionnaire was the Attributed Charisma subscale of the Multifactor Leadership Questionnaire (MLQ-A, Bass, 1985; Bass & Avolio, 1993). This subscale comprises 4 items that measure the extent to which the speaker is perceived as being able to build trust, inspire power and pride, and put the interests of their followers above their own. Example items are “The person you have just heard would go beyond self-interest for the good of the group”. Both scales have undergone rigorous validation procedures in numerous previous studies to ensure their validity and reliability in assessing charisma across diverse contexts.
The consistency of the participants' ratings across the multiple items in the scales was assessed by Intra Class Correlation (ICC) and Cronbach’s Alpha. These measures assess the agreement among the different items within a scale. The consistency of the GCI ratings across the 6 items yielded an Intra Class Correlation (ICC) of .65 and a Cronbach’s Alpha of .95. The scale’s mean rating was 3.36, SD = 1.09. The MLQ-A rating consistency yielded an ICC of .51; Cronbach’s alpha .96; mean rating = 3.51 and SD = 1.02. These values indicate a high level of internal consistency for both the GCI and MLQ-A scales, as well as good agreement among raters. They also support the use of lecturer-level aggregates of student ratings in subsequent analyses.
The participants’ ratings from the two questionnaires were processed to provide a single target variable. Since the participants’ responses did not take the form of a single value but rather were fragmented across the 6 items of the GCI scale and the 4 items of the MLQ-A scale, the responses to the items were averaged to provide two rating scores per speaker. These scores underwent a transformation to avoid an averaging bias (Charte et al., 2019). This transformation involves a “stretching” of the rating score range into a scale of categories, fit to the number of desired rating categories, where the number of values is equally distributed across the categories (Aharonson et al., 2023).
We used three rating categories representing the low, middle, and highcharisma levels. As is typical in Likert-scale ratings, especially in subjective constructs like perceived charisma, a central tendency bias was observed (Aston et al., 2022). Raters disproportionately selected the neutral/midpoint value ("middle charisma") compared to extreme options ("low" or "high"). This resulted in an under-representation of both low-charisma and high-charisma examples, which severely hinders the performance of supervised learning models, especially in multi-class classification (Charte et al.,2019).To mitigate this, a synthetic minority oversampling technique (SMOTE) algorithm (Chawla et al., 2002) was applied (described later in the Machine Learning Experiments section). This algorithm balanced the three-level distribution of classes synthetically within the machine learning training and is described later in this section. This operation enhanced the model’s capacity to distinguish across the full spectrum of perceived charisma levels.
Extraction of Acoustic Attributes
The original audio files—in YouTube stereo MP3 format—were converted to mono WAV format using the Pythonpydub library. The files’ waveforms and spectrograms were compared to ensure that the conversion did not distort the files. Attributes from three categories of speech attributes—rhythm, pitch, and loudness—were computed from the audio files using theOpenSMILE®Emobasetoolbox (Eyben et al., 2010). While Emobase offers a much larger choice of voice attribute types (spectral attributes, i.e., formants, or voice quality attributes, i.e., jitter), our focus on rhythm, pitch, and loudness attributes follows extensive literature that associated them with expressive voice and charisma. In addition, those attributes are easier to explain to non-technical potential users, i.e., educators, where other attribute types, such as formants, spectral, and cepstral speech coefficients, are less interpretable and practical (Pisanski et al., 2012). Finally, while more attributes, prosodic or other, could contribute to our analysis, for an ML model, a larger set of attributes would necessitate the use of a much larger number of speakers. Details on the Emobase extraction of attributes can be found in the OpenSMILE documentation (Eyben et al., 2010). Briefly, pitch extraction was based on autocorrelation or subharmonic summation methods. Loudness extraction employed a measure of the perceived loudness of the audio signal based on psychoacoustic principles. The rhythm attribute measured speaking rate by the number of voiced segments per second. The Emobase tools include first- and second-order derivatives of each category of attributes. The derivatives were excluded from our analysis to reduce the size of the attribute set. For each attribute category—pitch, loudness, or rhythm—nineteen functionals were selected for our analysis. To simplify the technical name, we refer to the 'functionals' as 'speech attributes'. This selection included the first attributes of the Emobase tool for pitch, loudness, and rhythm, which were used in previous studies (Hiroyuki & Rathcke, 2016; Niebuhr et al., 2016; Scherer et al., 2003). These attributes are: average (toolbox notation: 'mean'), standard deviation ('std'), maximal value ('max'), minimal value ('min'), skewness, kurtosis, the distribution’s three quartiles ('quartile_1', 'quartile_2', 'quartile_3'), and inter-quartiles ratios ('irq1–2', 'irq2–3', 'irq1–3') the first and second coefficients of the linear regression fit ('linreg_c1', 'linreg_c2') and the absolute and quadratic errors of this fit ('linregerrA', 'linregerrQ'), and the frequencies of the minimum and maximum amplitudes ('min_pos', 'max_pos'). The extraction of these 19 attributes for the three speech-attribute categories yielded a set of 57 attributes for each speech recording.
Machine Learning Experiments
ML experiments were conducted using the Python Scikit-learn framework (Hao & Ho, 2019). In every experiment, 57 extracted acoustic attributes served as inputs to an ML classifier, and the output was a three-level charisma prediction: low, medium, or high. The ML classifier used was Random Forest (RF), fixed at 100 trees with Gini impurity, unlimited depth, and a minimum of one sample per leaf. These settings have shown a favorable bias–variance trade-off while remaining computationally efficient (Breiman, 2001;Scornet et al., 2015). Model performance was estimated with a nested, 10-repetition, stratified 5-fold cross-validation: In every outer split, the data was divided into five folds that preserved the proportions of the low-, mid-, and high-charisma classes. Four folds (80 %) formed the outer training set, and the remaining fold (20 %) served as an independent test set. This partitioning was repeated ten times, with different random seeds, and yielded 50 unique train–test pairs. Each outer training set underwent an inner stratified 5-fold cross-validation, without exposing the outer test data. For every inner split, the 57 acoustic attributes were scored, attributes with zero variance inside the training portion were removed, and SMOTE (Chawla et al., 2002) equalized the three-charisma class counts. The inner loop produced five F1-scores (Wong & Yeh, 2020), which confirmed the absence of severe overfitting but did not drive any RF hyper-parameter choice; therefore, no information from the inner validation folds leaked into the outer test evaluation. SMOTE was then re-applied to the entire outer training set, the RF was retrained, and predictions were obtained for the untouched outer test folds. A 3×3 confusion matrix from each outer test fold provided an accuracy value (the sum of the matrix diagonal divided by the total observations). Mean accuracy and its standard deviation (SD) were calculated across the 50 outer folds. This method provides an unbiased estimate of the model's generalization performance (Poldrack et al., 2020; Wong & Yeh, 2020). Finally, the SHAP method (Lundberg & Lee, 2017) was applied to each outer-loop model, and the resulting Shapley values were averaged to rank the acoustic attributes by their contribution to the prediction of lecturer charisma.
The RF training, prediction accuracy assessment, and attributes importance analysis were applied in eight experiments. Each experiment included one of the four subsets of lecturer-speaker and student-listener combinations:female speaker–female listener, male speaker-male listener, female speaker-male listener, and male speaker-female listener, for one of the two charisma scales:GCI and MLQ-A.
Results
Table 1. Confusion Matrices of the Best Validation Run Predictions in the Eight Experiments, Female Speaker–Female Listener, Male Speaker-Male Listener, Female Speaker-Male Listener, Male Speaker-Female Listener,for the Two Charisma Scales, GCI and MLQ-A.Bold Numbers on The Diagonals Number of Correct Predictions of the Algorithm,and the numbers in the Off-Diagonals are the Incorrect Category Predictions
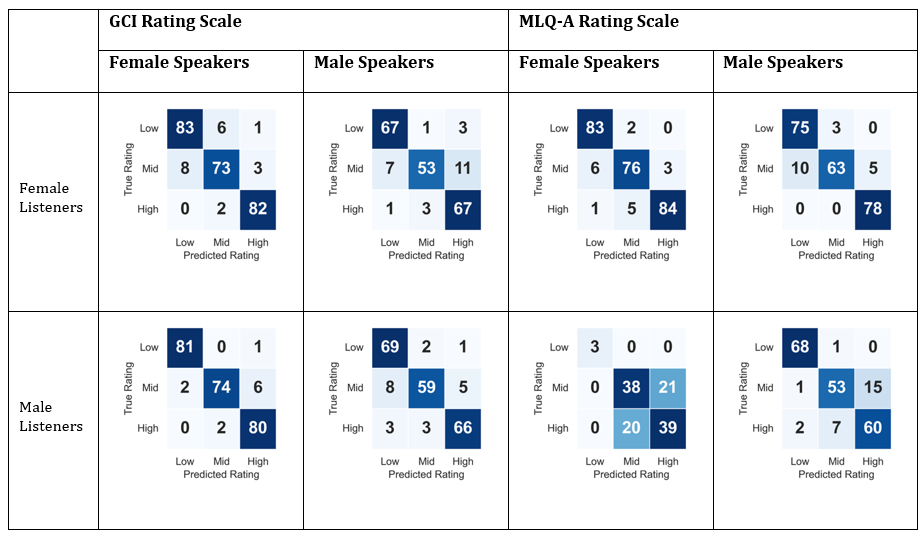
Table 1 presents the contingency (confusion) matrices for the three categoriesin the four experiments(female speaker–female listener, male speaker-male listener, female speaker-male listener, and male speaker-female listener) andfor each of the charisma scales (GCI and MLQ-A). The values are color-coded so thatdarkershades ofblue represent higher valuesandindicateinstances where the student-ratedcharisma levelsand the algorithm-predicted charisma levels agree.High values can be seen in the diagonals of all matrices.The off-diagonal elements,whichrepresent the cases where the algorithm’s prediction differs from the students’ charisma level, aresubstantiallysmaller than the diagonal values in all matrices. The confusion matrix of the male listeners-female speakers experiment has a low value for the low charisma prediction, stemming from the small number of these predictions in this subset of the data. This is reflected in the low average accuracy for this experiment in Table 2.The average and standard deviation of the accuracy in Table 2 were obtained by pooling the counts in the confusion matrices listed in Table 1, across all the cross-validation experiments. The female listeners-to-female lecturers model provided the best accuracy on both scales; in general, the model performed better for female lecturers.
Table 2.Prediction Accuracy in the Eight Experiments,Female Speaker–Female Listener, Male Speaker-Male Listener, Female Speaker-Male Listener, Male Speaker-Female Listener,for the Two Charisma Scales, GCI and MLQ-A.The Values Convey Average Accuracy and Standard Deviations (In Parentheses) Across the 50 Cross-Validation Runs for Each Experiment
| GCI ratings prediction accuracy | MLQ-A ratings prediction accuracy | ||||
| Female Speakers | Male Speakers | Female Speakers | Male Speakers | ||
| Female Listeners | 0.922 (0.033) | 0.878 (0.053) | 0.935 (0.01) | 0.923 (0.04) | |
| Male Listeners | 0.954 (0.036) | 0.898 (0.043) | 0.653 (0.09) | 0.874 (0.061) |
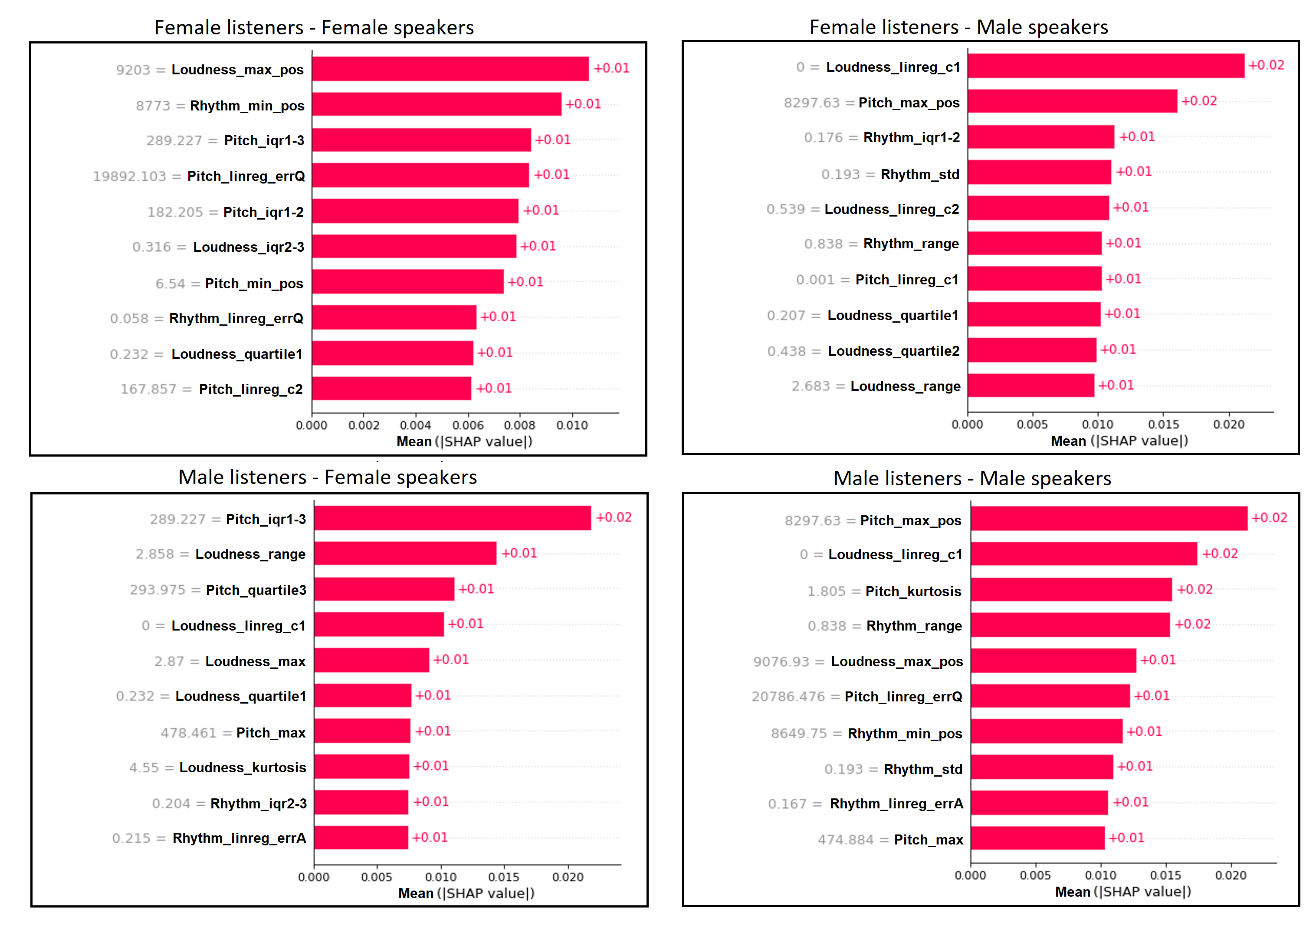
Figure 1. Shapley Importance Scores Values of the Top 10 Audio Attributes Selected for in the Prediction of the GCI Scale. The Four Graphs Depict the Scores in the Four Experiments: Female Speakers on the Left, Male Speakers on the Right, Female Listeners on Top, And Male Listeners at the Bottom. The Numbers at the Right of the SHAP Absolute Values Bars Are theAverage Magnitudeof That Attribute’s Contribution to the Model's Output Across All Predictions
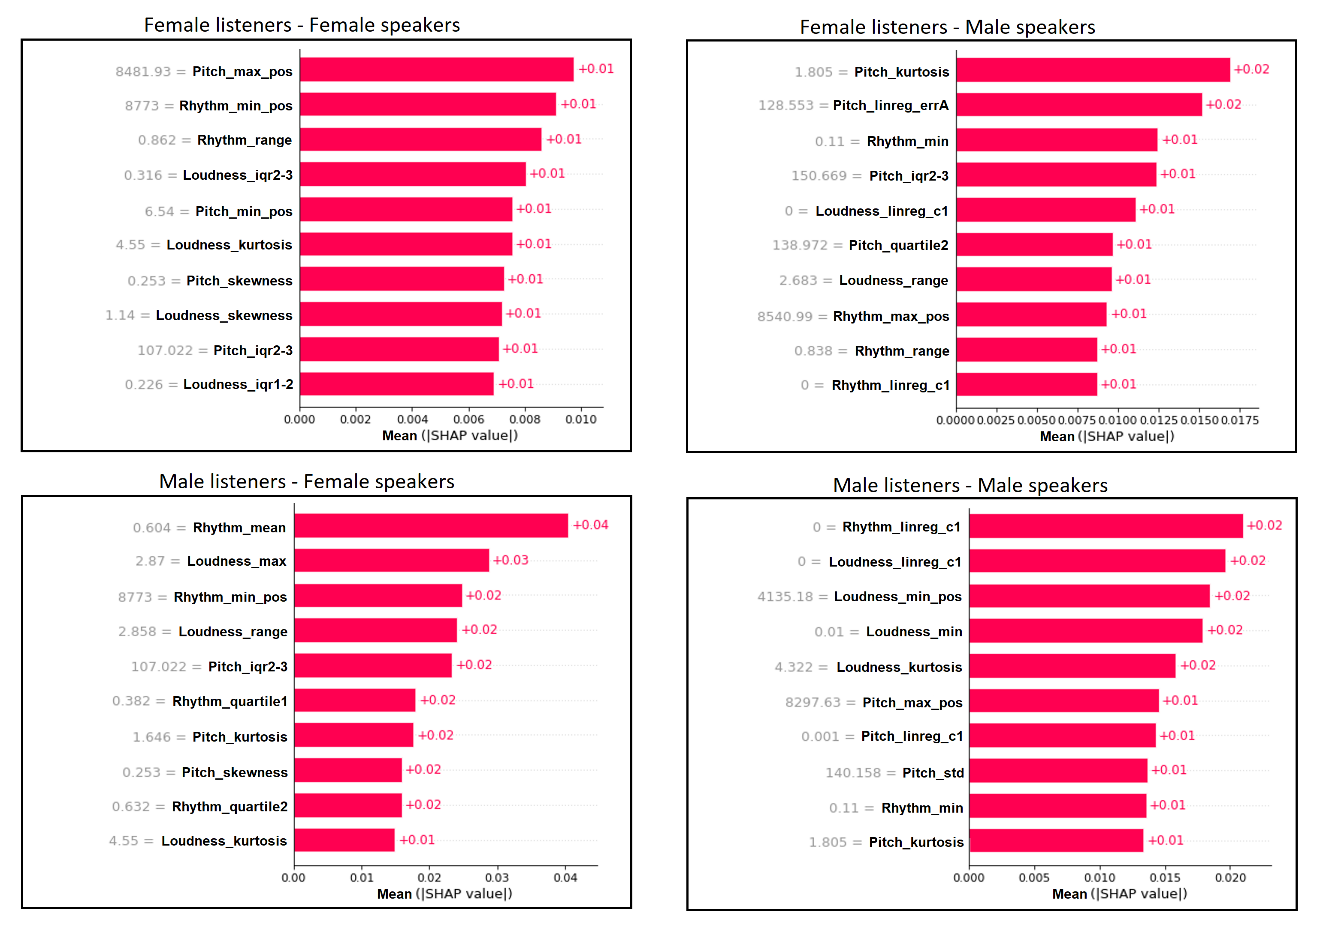
Figure 2. Shapley Importance Values of the Top 10 Voice Attributes Selected in the Prediction of the MLQ-A Rating Scale. The Four Bar Graphs Depict the Mean Absolute Shaley (SHAP) Values in the Four Experiments: Female Speakers on the Left, Male Speakers on the Right, Female Listeners on Top, And Male Listenersat The Bottom. The Shaded Numberstothe Leftofthe Attribute Names Correspond to the Mean Value of That Attribute Across the Experiment. The Numbers at theRight of the SHAP Barsarethe Average Magnitude of That Attribute’s Contribution to the Model's Output Across All Predictions
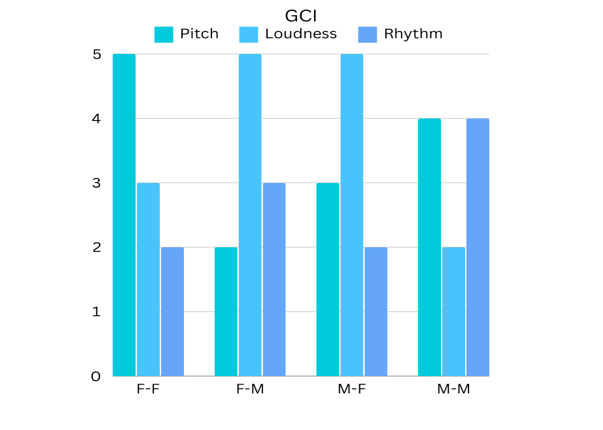
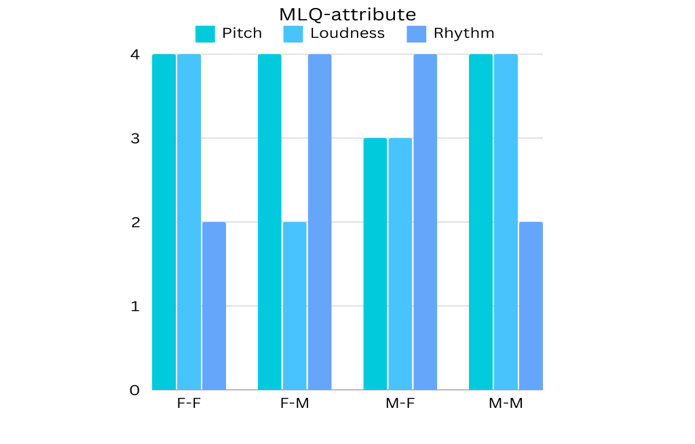
Figure 3. The Frequencies of the Attribute Categories - Pitch, Loudness, And Rhythm - Among the Top-TenAttributes Selected by the ML Model for the GCI And MLQ-A Rating Scales. The Abbreviations in the Horizontal Axis Refer totheFour Experiments of the Listeners and Speakers Groups: Female Listeners - Female Speakers (F-F), Female Listeners-Male Speakers (F-M), Male Listeners-Female Speakers (M-F), And Male Listeners-Male Speakers (M-M)
The Shapley importance values of the top ten speech audio attributes that best contributed to the predictions of the GCI and the MLQ-A scales in the four experimentsare depicted in Figure 1 and Figure 2, respectively.The importance levels and the order of the attributes, as shown in the figures' bars, differ between the four experiments involving male or female lecturers (speakers) and male or female students (listeners). Figure 3 summarizes the information in Figs. 1 and 2 by grouping the attributes according to the three categories: pitch, loudness, or rhythm. As seen in the left bar graph of Figure 3, the GCI scale rating same-gender (female speaker–female listener and male speaker-male listener) predictions of charisma have more pitch attributes and a smaller number of loudness attributes. Cross-gender predictions (female speaker-male listener and male speaker-female listener) showed a majority of loudness attributes and a smaller number of pitch attributes. The Rhythm attributes were the least frequent in all experiments except for the male speaker-male listener GCI predictions. In the right bar graph of Figure 3, the MLQ-A scale shows similar prominence of both pitch and loudness attributes and a small number of rhythm attributes in the same-gender predictions. The cross-gender predictions exhibit a distinct pattern, with a majority of rhythm attributes.
Table 3. The Presence of the 5 Most Frequent Voice Attributes of Male and Female Speakers Across All Experiments, for the GCI And MLQ-A Predictions. Capital Letters M and F Correspond to Male and Female Listeners
| GCI Ratings Predictions | MLQ-A Ratings Predictions | |||
| Contributing attributes | Female Lecturers | Male Lecturers | Female Lecturers | Male Lecturers |
| Loudness linreg_c1 | M | F & M | F & M | |
| Rhythm min_pos | F | M | F & M | |
| Pitch max_pos | F & M | F | M | |
| Rhythm range | F & M | F | F | |
| Loudness range | M | M |
Table 3 presents the five most frequent voice attributes selected by the RF algorithm to predict GCI and MLQ-Acharisma ratings for female and male speakers, as perceived by either male (M) or female (F) listeners. The most frequent attributes were the first coefficient -the Intercept - of the linear regression fit of the loudness(Loudness_linreg_c1), thefrequency where the voice had the lowest rhythm (rhythm_min_pos),the frequency where the voice signal has the highest pitch(pitch_max_pos), and the range of the rhythm and loudness values (rhythm_range,loudness_range). Except for one case of the pitchmax_posin male lecturers' voices, the trends of increase and decrease in the two rating scales agree. These findings indicate that the relative importance of vocal cues shifts depending on the interaction between lecturer gender and listener gender, suggesting that identical vocal behaviors can be interpreted differently depending on who delivers them and who hears them. In addition, prediction accuracy was generally higher for the GCI than for the MLQ-A. This may reflect differences in the dimensions of charisma each scale captures: the GCI focuses on influence and affability, dimensions that appear to be more directly and consistently cued by vocal features. In contrast, the MLQ-A includes items related to inspiration, trust, and self-sacrifice, which may depend more on contextual or non-vocal cues and thus are less consistently predicted from audio alone. Table 5 provides a description of the effects each of these five attributes has on the voice, with preliminary indications on how speakers can alter their voice to produce the changes conveyed in Table 4.The Interpretation and guidance are loosely adapted fromTitze and Abbott (2012).
Table 4. Directional Change in the Attributes Listed in Table 3, Comparing Samples of Low Charisma Ratings Versus High Chariusma Ratings. Arrows Indicate Whether the Attribute Value Increases (↑) Or Decreases (↓) as the Rating Shifts From Low to High
| Attribute | Low highGCI Ratings | Low highMLQ-A Ratings | ||
| Male Lecturers | Female Lecturers | Male Lecturers | Female Lecturers | |
| Loudness linreg_c1 | ||||
| Rhythm min_pos | ||||
| Pitch max_pos | ||||
| Rhythm range | ||||
| Loudness range |
Table 5. A Loose Interpretation of the Practical Effects of the Changes in Table 4 on Voice (adapted fromTitze &Abbott, 2012)
| Attribute | Interpretation of effect on voice (adapted from Titze & Abbott, 2012) | Practical guidance (adapted from Titze & Abbott, 2012) |
| Loudness linreg_c1 | Speech starts quieter, creating a softer or more subtle opening impression | Begin phrases gently, starting softly and building louder if needed |
| Rhythm min_pos | Consistent pacing at faster speech segments, creating clarity at quicker rhythms or less extended pauses | Focus on shortening pauses and quicker segments. |
| Pitch max_pos | Loudest, most resonant speech moments are deeper (lower) in pitch, giving a warmer, more authoritative quality. | Practice loud vocalization exercises focusing on chest resonance (vowels like "oh" and "ah" deeply projected). |
| Rhythm range | Greater variability in speech rate, creating dynamic and expressive speech | Alternate deliberately between slow, moderate, and rapid speaking |
| Loudness range | More dynamic speech, with greater variation between soft and loud moments, enhancing expressiveness and engagement. | Regularly alternate between whisper-level soft speech and strong, projected voice |
Discussion
Our results demonstrate that students’ charisma ratings of lecturers can be predicted from non-verbal vocal cues alone, without relying on any verbal content. In other words, how instructors speak – their vocal tone and delivery – was a strong indicator of perceived charismatic leadership in the classroom. By applying a machine learning approach, we identified a specific combination of acoustic features that collectively explain these perceptions of charisma. This data-driven method enabled us to move beyond examining individual factors in isolation and to uncover the combined effect of multiple vocal attributes, a novel contribution in this domain. In particular, attributes of three voice prosody categories – pitch, rhythm, and loudness – emerged as prominent predictors, and corroborated previous findings (Quenéet al., 2016).
The Role of Pitch, Rhythm, and Loudness in Shaping Charismatic Impressions
Pitch: Lecturers with a lower average pitch in the loudest, most resonant parts of their speech were rated as more charismatic. This trend aligns with previous findings that deeper voices convey authority and confidence (Klofstad et al., 2012). This supports the idea that voice pitch serves as a proxy for dominance and leadership presence, where lower frequencies are associated with larger body size and assertiveness (Klofstad et al., 2012). Our results additionally show that dynamic pitch variation, captured among the top 10 attributes, is associated with higher perceived charisma. Inflected pitch, rather than monotone, likely expresses enthusiasm and emotional engagement, and enhances listeners’ impressions of charisma
Rhythm (voicing probability and speech fluency): A Smooth, fluent speaking style contributed to a higher charisma rating. Lecturers who spoke with fewer awkward pauses, filler hesitations, or interruptions created an interesting and absorbing pattern for students. This finding suggests that maintaining a steady, well-paced rhythm in speech helps keep students’ attention and interest, thereby enhancing the speaker’s charismatic appeal. Notably, prior studies largely overlooked rhythm as a charisma factor. Our study highlighted this attribute as a novel vocal charisma cue in educational settings.
Loudness (speech intensity): Dynamic alterations of loudness along the speech, starting with softer intensity, contributed to high charisma ratings. These results suggest that in classroom communication, moderate loudness is sufficient and is subtly combined with pitch and rhythm attributes to convey charisma. The diminished impact of loudness could reflect that students prioritize how interesting or passionate the delivery sounds (via tone and flow) over sheer volume once a basic level of audibility is met.
Thus, the present study provides empirical evidence that vocal signaling plays a significant role in shaping perceptions of charisma in educational contexts. Listeners appear to associate specific vocal patterns with charismatic lecturers. Similar to political and business leaders who adapt their delivery to different audiences, lecturers may adjust their vocal style in real time to maintain credibility, foster engagement, and enhance their impact in the classroom.
Gender-Specific Vocal Patterns in Charismatic Communication
Another important contribution of this work is the demonstration that a lecturer's gender interacts with specific vocal characteristics to shape learners’ perceptions of charisma. These interaction patterns suggest that listeners apply gender-specific expectations to vocal delivery, shaping how identical vocal behaviors are perceived depending on who uses them. This highlights the importance of considering both the speaker’s gender and vocal strategy when evaluating or training for charisma in educational contexts. Overall, we found more similarities than differences: both male and female lecturers’ charisma ratings were driven by pitch, rhythm, and loudness cues, suggesting that the fundamental vocal signals of charisma are effective across genders. This finding resonates with recent cross-cultural research, which shows that male and female leaders tend to manipulate pitch in analogous ways to convey dominance and enthusiasm, suggesting a biologically based mechanism for vocal charisma that transcends gender (Signorello et al., 2020). However, previous studies have also noted that lower-pitched voices are preferred in leaders of both genders; yet, women, on average, have higher pitches, which may unconsciously disadvantage them in charismatic evaluations (Klofstad et al., 2012). This nuance suggests that a female lecturer might need to rely more on relative pitch changes (such as varying intonation or using a more resonant tone) to project charisma, whereas a male lecturer might benefit simply from using his lower register consistently. In summary, our inclusion of gender as a factor provides a richer understanding of charismatic speech, confirming that both men and women can convey charisma through voice alone, while also highlighting the social and perceptual context in which this vocal signaling occurs.
Charisma Rating Scales and Lecturer’s Voice
Our methodology included two distinct rating instruments for measuring charisma, adding robustness and generalizability to the findings. These two instruments reflect different theoretical angles. The MLQ situates charisma as a component of effective leadership behavior, while the GCI treats charisma as a more general interpersonal trait of likability and persuasiveness. Our voice-based machine learning models showed consistently high prediction accuracy across both measures, and similar sets of vocal attributes from the pitch, rhythm, and loudness categories contributed to the prediction of charisma with both scales. These results indicate that the core signaling of vocal charisma was captured, rather than an artefact of any single measurement approach. Moreover, by incorporating the GCI scale, which includes a warmth/affability dimension, we extend prior research that often focused narrowly on the MLQ subscale to measure charisma. This dual-measure approach therefore enriches the theoretical implications, suggesting that both commanding presence and relational warmth appear to be conveyed through voice. From a practical standpoint, vocal training interventions for lecturers may have a more direct influence on the interpersonal warmth and perceived influence captured by GCI, whereas the broader leadership qualities measured by MLQ-A may require additional behavioral or relational signals beyond voice.
Conclusion
Our findings highlight vocal attributes, particularlydynamics of pitch, speech rhythm, and loudnessthatinfluence students’ perceptions of lecturer charisma, with notable differences based on the gender of both the speaker and the listener.We demonstrate empirically that charismatic leadership can be conveyed through voice alone, supporting theories that conceptualize charisma as a form of nonverbal communication or “signal” from leaders to followers. This adds evidence to the argument that, beyond inspiring vision or intellectual stimulation, a lecturer’s tone of voice itself is a pivotal aspect of their charisma perceptions in the classroom. In addition,the study pioneers the application of validated charisma scales, coupled with automated speech prosodic attributes and interpretable ML classifiers, to the domain of teaching-related charisma.The explainable machine learning method used provides a reliable and interpretable method for identifying vocal patterns associated with charismatic delivery. These insights offer practical value for developing tools to enhance teaching effectiveness.
Recommendations
Vocal delivery matters, and it is a trainable skill. Rather than relying solely on content expertise, educators should actively develop their vocal communication skills as part of their professional toolkit. Our study shows a step toward more evidence-based approaches to cultivating charisma. By highlighting concrete vocal behaviors that can be practiced and improved, we move closer to demystifying charisma and providing educators with some specific, actionable strategies to enhance their impact (as suggested in Table 5). Our findings suggest that instructors can improve their perceived charisma by working on measurable and attainable vocal behaviors. These teachable elements can be developed into strategies implemented in teacher training and professional development programs. Modules on vocal delivery in these programs may include training in pitch control, using pauses effectively, modulating vocal energy, and avoiding disfluencies such as filler words (Table 5). Moreover, our results support the integration of technology-assisted tools, such as AI-based vocal analysis and biofeedback systems, into teacher development programs. These tools can provide real-time feedback on vocal performance, enabling educators to identify and adjust aspects of their delivery that impact students’ perception of charisma. For instance, if a teacher’s rhythm is overly choppy or their intonation is too flat, the system could suggest targeted vocal exercises. By grounding such interventions in evidence from our study, these tools can move beyond generic advice and instead offer real-time, actionable guidance for improving classroom presence.
Limitations
Several limitations may constrain the interpretation of our results. First, as noted in previous literature, the results may be limited by the subjectivity of the charisma rating scales and the wider complexity of the concept of charisma. Second, the focus on pitch, loudness, and rhythm attributes was based on previous findings that featured these attributes' association with expressive and charismatic voice, on the practicality of explaining and interpreting these attributes to speakers, and on the practicability of limiting the size of our attribute set to be reliably processed by the ML algorithm, given the number of sample data. It could, however, limit the scope, as other voice attributes (i.e., formants, jitter) may enhance the prediction with a larger dataset of speakers. Third, automated voice analysis offers objectivity and scalability; however, it cannot fully replicate human listeners’ integration of contextual, semantic, and cultural cues (Cowen & Keltner, 2021). Fourth, several potential confounding variables should be acknowledged. Since vocal tone, rather than full comprehension of verbal content, was the primary basis for evaluation, it is not clear whether varying levels of English fluency meaningfully influenced listeners’ ratings. Vocal cues such as pitch, energy, and pacing can be perceived even with limited language proficiency, suggesting that full comprehension may not be necessary for forming charisma judgments. Nonetheless, we acknowledge this as a potential limitation and recommend that future research further investigate how language fluency might shape or constrain voice-based impressions of charisma. In addition, it is possible that other factors, such as the semantic content of the speech, the lecturer’s level of teaching experience, or differences in recording quality, may have influenced listeners’ ratings. Although the stimuli were standardized in format and presentation, these factors were not fully controlled, which may have introduced unintended variance. Future research could employ more tightly controlled experimental designs to systematically isolate vocal attributes from content and contextual influences. Finally, perceptions of vocal charisma may vary across cultural and contextual settings. What is considered engaging or authoritative in one culture may be perceived as aggressive or inappropriate in another (House et al., 2004). Similarly, classroom norms, power distance, and expectations of teacher behavior can influence how vocal cues are interpreted (Hofstede, 2011; Neuliep, 2012). For instance, in high power-distance cultures, a soft and measured tone may be seen as respectful and credible, while in low power-distance contexts, a more dynamic and personable delivery may be preferred (Molinsky, 2007). Future research should explore how these cultural and situational factors shape the embodied processing of vocal signals and the attribution of charisma.
Ethics Statements
The study was reviewed and approved by the Arison School of Business, Reichman University ethics committee. The participants provided their written informed consent to participate in this study.
The authors declare no competing interests.
Generative AI Statement
As the authors of this work, we used the AI tool ChatGPT for the purpose of editing and English editing. After using this AI tool, we reviewed and verified the final version of our work. We, as the authors, take full responsibility for the content of our published work.
Authorship Contribution Statement
Katz-Navon: Conceptualization, design, data acquisition, writing, editing, reviewing. Aharonson: conceptualization, design, statistical analysis, writing, editing, reviewing, supervision. Malachi: statistical analysis, writing.